US6789054B1 - Geometric display tools and methods for the visual specification, design automation, and control of adaptive real systems - Google Patents
Geometric display tools and methods for the visual specification, design automation, and control of adaptive real systems Download PDFInfo
- Publication number
- US6789054B1 US6789054B1 US09/299,235 US29923599A US6789054B1 US 6789054 B1 US6789054 B1 US 6789054B1 US 29923599 A US29923599 A US 29923599A US 6789054 B1 US6789054 B1 US 6789054B1
- Authority
- US
- United States
- Prior art keywords
- objects
- real
- model
- loop
- geometric
- Prior art date
- Legal status (The legal status is an assumption and is not a legal conclusion. Google has not performed a legal analysis and makes no representation as to the accuracy of the status listed.)
- Expired - Fee Related
Links
- 238000013461 design Methods 0.000 title claims abstract description 126
- 230000003044 adaptive effect Effects 0.000 title claims abstract description 62
- 238000000034 method Methods 0.000 title claims description 389
- 230000000007 visual effect Effects 0.000 title claims description 19
- 230000003068 static effect Effects 0.000 claims abstract description 60
- 230000006870 function Effects 0.000 claims description 125
- 230000008569 process Effects 0.000 claims description 99
- 238000004891 communication Methods 0.000 claims description 56
- 230000006399 behavior Effects 0.000 claims description 40
- 230000004044 response Effects 0.000 claims description 34
- 230000003993 interaction Effects 0.000 claims description 33
- 239000000203 mixture Substances 0.000 claims description 31
- 238000004220 aggregation Methods 0.000 claims description 24
- 238000005259 measurement Methods 0.000 claims description 24
- 230000002776 aggregation Effects 0.000 claims description 23
- 150000001875 compounds Chemical class 0.000 claims description 19
- 230000000694 effects Effects 0.000 claims description 17
- 238000010168 coupling process Methods 0.000 claims description 14
- 238000005859 coupling reaction Methods 0.000 claims description 14
- 238000012544 monitoring process Methods 0.000 claims description 13
- 230000008878 coupling Effects 0.000 claims description 12
- 238000012546 transfer Methods 0.000 claims description 10
- 238000005192 partition Methods 0.000 claims description 7
- 125000004122 cyclic group Chemical group 0.000 claims description 6
- 238000004088 simulation Methods 0.000 claims description 6
- 230000008520 organization Effects 0.000 claims description 4
- 230000035945 sensitivity Effects 0.000 claims description 3
- 230000004913 activation Effects 0.000 claims description 2
- 238000004590 computer program Methods 0.000 claims 11
- 230000003213 activating effect Effects 0.000 claims 2
- 230000006978 adaptation Effects 0.000 claims 1
- 230000033772 system development Effects 0.000 abstract description 4
- 238000005094 computer simulation Methods 0.000 abstract description 3
- 238000010200 validation analysis Methods 0.000 abstract description 2
- 238000012795 verification Methods 0.000 abstract description 2
- 238000012545 processing Methods 0.000 description 40
- 238000004458 analytical method Methods 0.000 description 28
- 238000004422 calculation algorithm Methods 0.000 description 26
- 238000010586 diagram Methods 0.000 description 21
- 230000010354 integration Effects 0.000 description 20
- 238000003860 storage Methods 0.000 description 20
- 210000004027 cell Anatomy 0.000 description 16
- 238000011161 development Methods 0.000 description 16
- 230000018109 developmental process Effects 0.000 description 16
- 238000007726 management method Methods 0.000 description 15
- 238000013439 planning Methods 0.000 description 15
- 238000004519 manufacturing process Methods 0.000 description 14
- 230000009471 action Effects 0.000 description 13
- 239000011159 matrix material Substances 0.000 description 12
- 230000007704 transition Effects 0.000 description 11
- 230000001413 cellular effect Effects 0.000 description 10
- 230000007246 mechanism Effects 0.000 description 8
- 230000001360 synchronised effect Effects 0.000 description 7
- 238000005314 correlation function Methods 0.000 description 6
- 230000033001 locomotion Effects 0.000 description 6
- 238000013507 mapping Methods 0.000 description 6
- 230000002085 persistent effect Effects 0.000 description 6
- 230000002123 temporal effect Effects 0.000 description 6
- 238000012360 testing method Methods 0.000 description 6
- 238000012356 Product development Methods 0.000 description 5
- 230000008859 change Effects 0.000 description 5
- 238000010276 construction Methods 0.000 description 5
- 238000007728 cost analysis Methods 0.000 description 5
- 230000009466 transformation Effects 0.000 description 5
- 230000001960 triggered effect Effects 0.000 description 5
- 241000196324 Embryophyta Species 0.000 description 4
- 230000003190 augmentative effect Effects 0.000 description 4
- 230000003542 behavioural effect Effects 0.000 description 4
- 230000015572 biosynthetic process Effects 0.000 description 4
- 230000001149 cognitive effect Effects 0.000 description 4
- 238000000354 decomposition reaction Methods 0.000 description 4
- 230000003247 decreasing effect Effects 0.000 description 4
- 230000001419 dependent effect Effects 0.000 description 4
- 238000009826 distribution Methods 0.000 description 4
- 238000011835 investigation Methods 0.000 description 4
- 230000007257 malfunction Effects 0.000 description 4
- 239000000463 material Substances 0.000 description 4
- 238000010206 sensitivity analysis Methods 0.000 description 4
- 238000003786 synthesis reaction Methods 0.000 description 4
- 230000015556 catabolic process Effects 0.000 description 3
- 238000011156 evaluation Methods 0.000 description 3
- 238000002474 experimental method Methods 0.000 description 3
- 239000012634 fragment Substances 0.000 description 3
- 230000010365 information processing Effects 0.000 description 3
- 230000000670 limiting effect Effects 0.000 description 3
- 238000011084 recovery Methods 0.000 description 3
- 230000001373 regressive effect Effects 0.000 description 3
- 238000012421 spiking Methods 0.000 description 3
- 238000011144 upstream manufacturing Methods 0.000 description 3
- 241000282412 Homo Species 0.000 description 2
- 238000013459 approach Methods 0.000 description 2
- 238000005311 autocorrelation function Methods 0.000 description 2
- 230000008901 benefit Effects 0.000 description 2
- 230000005540 biological transmission Effects 0.000 description 2
- 230000001364 causal effect Effects 0.000 description 2
- 210000003850 cellular structure Anatomy 0.000 description 2
- 238000013145 classification model Methods 0.000 description 2
- 238000004040 coloring Methods 0.000 description 2
- 230000009850 completed effect Effects 0.000 description 2
- 230000000875 corresponding effect Effects 0.000 description 2
- 230000001808 coupling effect Effects 0.000 description 2
- 230000001186 cumulative effect Effects 0.000 description 2
- 230000006378 damage Effects 0.000 description 2
- 230000007547 defect Effects 0.000 description 2
- 238000012938 design process Methods 0.000 description 2
- 230000009977 dual effect Effects 0.000 description 2
- 238000005538 encapsulation Methods 0.000 description 2
- 230000007613 environmental effect Effects 0.000 description 2
- 230000010429 evolutionary process Effects 0.000 description 2
- 239000003999 initiator Substances 0.000 description 2
- 238000007689 inspection Methods 0.000 description 2
- 238000009434 installation Methods 0.000 description 2
- 230000007774 longterm Effects 0.000 description 2
- 238000012423 maintenance Methods 0.000 description 2
- 230000036961 partial effect Effects 0.000 description 2
- 238000004886 process control Methods 0.000 description 2
- 238000013442 quality metrics Methods 0.000 description 2
- 239000002994 raw material Substances 0.000 description 2
- 230000002829 reductive effect Effects 0.000 description 2
- 230000001105 regulatory effect Effects 0.000 description 2
- 238000012916 structural analysis Methods 0.000 description 2
- 238000012800 visualization Methods 0.000 description 2
- PXFBZOLANLWPMH-UHFFFAOYSA-N 16-Epiaffinine Natural products C1C(C2=CC=CC=C2N2)=C2C(=O)CC2C(=CC)CN(C)C1C2CO PXFBZOLANLWPMH-UHFFFAOYSA-N 0.000 description 1
- 241000522213 Dichilus lebeckioides Species 0.000 description 1
- 235000009499 Vanilla fragrans Nutrition 0.000 description 1
- 244000263375 Vanilla tahitensis Species 0.000 description 1
- 235000012036 Vanilla tahitensis Nutrition 0.000 description 1
- 239000000654 additive Substances 0.000 description 1
- 230000000996 additive effect Effects 0.000 description 1
- 230000004931 aggregating effect Effects 0.000 description 1
- 230000032683 aging Effects 0.000 description 1
- 230000033228 biological regulation Effects 0.000 description 1
- 238000009529 body temperature measurement Methods 0.000 description 1
- 238000004364 calculation method Methods 0.000 description 1
- 230000002860 competitive effect Effects 0.000 description 1
- 230000008602 contraction Effects 0.000 description 1
- 230000001276 controlling effect Effects 0.000 description 1
- 238000012937 correction Methods 0.000 description 1
- 230000002596 correlated effect Effects 0.000 description 1
- 238000013499 data model Methods 0.000 description 1
- 230000001934 delay Effects 0.000 description 1
- 238000009795 derivation Methods 0.000 description 1
- 238000004141 dimensional analysis Methods 0.000 description 1
- 230000008846 dynamic interplay Effects 0.000 description 1
- 238000005183 dynamical system Methods 0.000 description 1
- 230000002708 enhancing effect Effects 0.000 description 1
- 238000009472 formulation Methods 0.000 description 1
- 239000000446 fuel Substances 0.000 description 1
- 230000014509 gene expression Effects 0.000 description 1
- 231100001261 hazardous Toxicity 0.000 description 1
- 230000014759 maintenance of location Effects 0.000 description 1
- 230000001404 mediated effect Effects 0.000 description 1
- 229910052751 metal Inorganic materials 0.000 description 1
- 239000002184 metal Substances 0.000 description 1
- 238000012986 modification Methods 0.000 description 1
- 230000004048 modification Effects 0.000 description 1
- 238000010606 normalization Methods 0.000 description 1
- 238000005457 optimization Methods 0.000 description 1
- 238000012856 packing Methods 0.000 description 1
- 230000004224 protection Effects 0.000 description 1
- 238000003908 quality control method Methods 0.000 description 1
- 230000004043 responsiveness Effects 0.000 description 1
- 230000002441 reversible effect Effects 0.000 description 1
- 238000004092 self-diagnosis Methods 0.000 description 1
- 238000000638 solvent extraction Methods 0.000 description 1
- 239000000126 substance Substances 0.000 description 1
- 230000004083 survival effect Effects 0.000 description 1
- 230000036962 time dependent Effects 0.000 description 1
- 230000001131 transforming effect Effects 0.000 description 1
- 238000013519 translation Methods 0.000 description 1
- 230000035899 viability Effects 0.000 description 1
- 239000002699 waste material Substances 0.000 description 1
Images


Classifications
-
- G—PHYSICS
- G06—COMPUTING; CALCULATING OR COUNTING
- G06F—ELECTRIC DIGITAL DATA PROCESSING
- G06F8/00—Arrangements for software engineering
- G06F8/10—Requirements analysis; Specification techniques
-
- G—PHYSICS
- G09—EDUCATION; CRYPTOGRAPHY; DISPLAY; ADVERTISING; SEALS
- G09G—ARRANGEMENTS OR CIRCUITS FOR CONTROL OF INDICATING DEVICES USING STATIC MEANS TO PRESENT VARIABLE INFORMATION
- G09G5/00—Control arrangements or circuits for visual indicators common to cathode-ray tube indicators and other visual indicators
Definitions
- This invention relates to open development and run time environments of computer based systems, integrated system architectures, adaptive fuzzy systems, fractal geometry, and formal geometric computer languages.
- a complex system requires a wide variety of physical communication interconnections. Distribution of its application functions is dictated by geographical distribution of user locations, economy of design, or high levels of processing loads.
- a complex system has many distributed databases which require stringent control algorithms for data integrity, transaction correctness, transaction atomicity, reconfiguration, and concurrency.
- Real-time constraints A complex system has real-time constraints which cannot be exceeded without causing severe system malfunctions.
- the vulnerability of real-time systems imposes adaptability requirements on their design and run time operation where system functions may be dedicated to a processor or allowed to migrate among different processors. This entails trade-off analysis of software complexity, reliability, and dynamic load balancing.
- a complex system may be monitoring thousands or millions of distributed sensors with distributed functions for fail-soft operation, self-diagnosis, self-simulation, and self-correction.
- the time evolution of these sensors is subject to input/output timing and synchronization problems within the physical processes and their environment.
- a complex system is a strongly interacting multivariable system where a change in one input variable produces a change in many other variables.
- Input variables are almost always statistical and time variant.
- Malicious and accidental interruptions A complex system may be subjected to criminal activities, jamming of communication lines, or the partial destruction of any of their elements. Significant loss of human life, destruction of equipment, and loss of valuable information may result from malfunction of the sensor instrumentation, the processor hardware, or software.
- Human-machine interactions A complex system performance depends on the interaction between humans and machines performing together. Determination of the proper boundaries separating machines from human functions in a hazardous system environment does not remain static during the system life cycle.
- Syntax and semantics of their graphs do not capture critical aspects of the system static and dynamic configuration constructs such as the geographical allocation of system resources to system nodes, and scheduling of system resources to meet evolving operational system requirements.
- This invention provides new, physics-like computational models, called M computational models, which are used to capture and integrate the static and dynamic architecture of a real system.
- An M model is specified using a formal geometric language called the M Language.
- Design automation of an M model is carried out using a set of tools called Adaptive Model Reference (AMR) tools. These tools automate the integration of system components into operational systems that can be adapted during run time to meet end users' functional and system performance requirements.
- M Language To provide a formal geometric language called the “M Language” supported by automated tools. This language provides syntactically valid visual sentences, and provides semantic and mathematical interpretation of these sentences.
- the M language provides generalized icons for annotating system objects, and associates a geometric region with each object. These regions are geometrically arranged to specify geometric plan and elevation projections of the static and dynamic structure of a real system.
- the M language is diagram-based, and is generalized icon-based where the icon of each region provides the dual representation of a physical part (the pictorial image) and a logical part (the meaning).
- M models are geometric, bipartite, directed, token based models specified using the M language.
- M models capture in a single geometric graph type the information now typically specified by a set of graph types such as tree graphs, inheritance graphs, state transition graphs, data flow graphs, control flow graphs, and Petri Net graphs.
- M static architecture To provide expert rules and tools used to construct a static architecture of a real system called the “M static architecture”. This architecture provides an integrated geometric specification of object classification, association, and composition relationships between the component objects of a real system.
- M dynamic architecture To provide expert rules and tools used to construct a dynamic architecture of a real system called the “M dynamic architecture”. This architecture provides a geometric specification of the constrained behavior of a real system. An M dynamic architecture is specified using a new type of networks called “Adaptive Loop Information Nets” (ALI_Nets). Each ALI_Net specifies behavior and functional performance goals of a semantic system partition which is observable, controllable, and configurable.
- ALI_Nets Adaptive Loop Information Nets
- M Integrated Architecture To provide expert rules and tools used to construct an integrated architecture of a real system, called an “M Integrated Architecture”. This architecture integrates into a single geometric graph the operational requirements architecture, which specifies performance constrained interactions between external system objects, and the design control architecture which specifies performance constrained interactions between internal system objects.
- control is used to mean all aspects of decision making that are applied to adapt a system during its development to compensate for requirement changes and design errors, and during run time operation to compensate for unanticipated operational system conditions.
- an adaptive multi-level design control scheme which monitors, controls and adapts the behavior of the multi-layer integrated architecture of a real system.
- This scheme is composed of a set of concurrent control processes which are supervised by a set of adaptive supervisory control processes. Lower levels of the adaptive scheme regulate physical resources of a real system. Higher levels control and adapt distributed information processing functions.
- Static structure metrics include fractal dimension, entropy coupling, and deadlock metrics.
- Dynamic structure metrics include load, service time, response time, and utilization level metrics.
- FIG. 0 Coloring Scheme Legend
- FIG. 1 Adaptive Model Reference Procedures
- FIG. 2 M Cellular Display
- FIG. 3 Geometric Encapsulation of Object Resources
- FIG. 4 Geometric Composition of an Object Region
- FIG. 5 Geometric Composition of a Resource Region
- FIG. 6 Folded and Unfolded Object Regions with an Internal Shared Resource Region
- FIG. 7 Folded and Unfolded Object Regions with an Internal Private Resource Region
- FIG. 8 Folded and Unfolded Resource Region
- FIG. 9 Folded and Unfolded Public Interface Region of an Object
- FIG. 10 Isomorphic Projections of an Unfolded Region
- FIG. 11 Folding and Unfolding Rules of the Real Numbers Set
- FIG. 12 Geometric Composition of an M Atomic Connection
- FIG. 13 Geometric Projections of a Multi-layer Stack of Objects
- FIG. 14 Encapsulation of a Resource Region
- FIG. 15 Geometric Projection Rules of Multiple Stacks of Layered Objects
- FIG. 16 Features Table of Various Object Oriented Design Methods
- FIG. 17 Static Models used by Object Oriented Design Methods
- FIG. 18 Dynamic Models used by Object Oriented Analysis Methods
- FIG. 19 The Not-integrated Set of Dynamic and Static Models used by Object Oriented Design Methods
- FIG. 20 Geometric Representation Rules of Hierarchical Data Structures
- FIG. 21 Geometric Representation Rules of Hierarchical Function Structures
- FIG. 22 Geometric Representation Rules of State Transition Graphs
- FIG. 23 Geometric Representation Rules of Data Flow Graphs
- FIG. 24 Geometric Representation of Mode B Data Flow Graphs
- FIG. 25 Geometric Representation of Petri Net Token Based Graphs
- FIG. 26 Folded Geometric Representation of an M Model
- FIG. 27 Geometric Representation of Logic Primitives
- FIG. 28 A Program Fragment Represented Using Geometric Primitives
- FIG. 29 Plan Projection of AMR Construction Procedures and Tools
- FIG. 30 Plan Projection of AMR Procedures and Tools
- FIG. 31 Plan Projection of AMR Knowledge Controller
- FIG. 32 Elevation Projection of AMR Tool-Supported Procedures
- FIG. 33 Plan Projection of a Real System
- FIG. 34 Elevation Projection of a Real System
- FIG. 35 Elevation Projection of an M Iterative Map of a Real System
- FIG. 36 Plan Projection of an M Iterative Map of a Real System
- FIG. 37 Time-Space Evolution Grid
- FIG. 38 Operational Model of AMR Architecture Specification & Analysis Tools
- FIG. 39 AMR Architecture Specification Procedure
- FIG. 40 Lower Level Composition of AMR Architecture Specification Procedures
- FIG. 41 Geometric Representation of Object Association Models
- FIG. 42 Geometric Interface of Object Association Models
- FIG. 43 Types of Object Constraints
- FIG. 44 Geometric Representation of an Object Classification Model
- FIG. 45 Geometric Representation of a Multiple Inheritance Model
- FIG. 46 Fractal Representation of a “Part_Of” Relationship
- FIG. 47 Fractal Representation of a “Has_A” Object Relationship
- FIG. 48 Fractal Representation of a “Knows_A” Object Relationship
- FIG. 49 Fractal Representation of a Multiple Object Attribution Relationship
- FIG. 50 Plan Projection of an Integrated Static Object Model
- FIG. 51 Fractal Composition of a System
- FIG. 52 Fractal Composition of Object Attributes
- FIG. 53 Attribute Sets of an Object
- FIG. 54 Orthogonal Projection of an Object
- FIG. 55 Object/Loop State Graphs
- FIG. 56 Geometric Representation of a Fuzzy Object
- FIG. 57 Multi-value Logic Representation
- FIG. 58 Orthogonal Projection of Aggregated Objects
- FIG. 59 Dynamic Architecture Model
- FIG. 60 ALI_Net Loop Composition
- FIG. 61 Plan Projection of an ALI_Net Composition Model
- FIG. 62 Plan Projection of an Aggregated Set of ALI_Nets
- FIG. 63 Open/Closed Designation of a Set of Object Loops
- FIG. 64 Cascade Aggregation Structures of a Set of Object Loops
- FIG. 65 Elevation Projection of Cascade Aggregation Structures of a Set of Object Loops
- FIG. 66 Parallel Aggregation Structures of a Set of Object_Loops
- FIG. 67 Elevation Projection of Parallel Aggregation Structures of a Set of Object_Loops
- FIG. 68 Multi-layer ALI_Net Composition of an Integrated Architecture
- FIG. 69 Elevation Projection of a Layered Object Loop
- FIG. 70 Fractal Representation of a Corba and a COM Object
- FIG. 71 Fractal Representation of an Interface Message Set
- FIG. 72 An Example of Two Connected Loops
- FIG. 73 An M Compound Connection
- FIG. 74 Basic Two Sided Communication Construct
- FIG. 75 Loop_Fork_Communication Construct
- FIG. 76 Loop_Branch_Communication Construct
- FIG. 77 Loop_Join_Communication Construct
- FIG. 78 Elevation Projection of the Connected Two Loop Example
- FIG. 79 High Level Plan Projection of the Connected Two Loop System Example
- FIG. 80 Lower Level Plan Projection of the Connected Two Loop System Example
- FIG. 81 “Message/Data/objects” Wiring Diagram, The Two Loop System Example
- FIG. 82 Multi Level Wiring Diagrams of Container and Contained Objects
- FIG. 83 Layered Composition of an ALI_Net Dynamic Graph
- FIG. 84 An ALI_Net Business Tracking Graph
- FIG. 85 An Aggregated ALI_Net Business Tracking Graph
- FIG. 86 Categories of Cognitive Models
- FIG. 87 Fuzzy Linguistic Models
- FIG. 88 The Two Design Space Models
- FIG. 89 Elevation Projection of the Object Loops of an Integrated Architecture
- FIG. 90 Geometric Representation of an Information Access Loop
- FIG. 91 ALI_Net Components of an Integrated Architecture
- FIG. 92 Layered structure of Nettronic, Infotronic and Mechatronic Container Objects
- FIG. 93 Elevation Projection of Nettronic, Infotronic and Mechatronic Object Stacks
- FIG. 94 Plan Projection of Nettronic, Infotronic and Mechatronic Object Stacks
- FIG. 95 Cellular Projections of a Set of Infotronic and Mechatronic Objects
- FIG. 96 Plan Projection of an Infotronic Object
- FIG. 97 Elevation Projection of a Two Node Architecture
- FIG. 98 Geometric Projection of a Cellular System Architecture
- FIG. 99 Multi-Dimensional Folding of an Object Region
- FIG. 100 Mapping of Virtual State Space Grid to Physical Space Grid
- FIG. 101 Euclidean Physical Space Grid
- FIG. 102 Operational Model of AMR Planning, Scheduling and Control Tools
- FIG. 103 AMR Planning Procedure
- FIG. 104 Geographical Configuration of System Objects
- FIG. 105 Specification of Geographical Constraints
- FIG. 106 Mechatronic Object Navigation Mechanisms
- FIG. 107 Cellular Allocation of Mechatronic and Infotronic Objects
- FIG. 108 Communication Connections
- FIG. 109 Human & Physical Objects Scheduling Procedure
- FIG. 110 Operational Model of the AMR Automated System Control Scheme
- FIG. 111 Plan Projection of the AMR Control Scheme of an Automated System
- FIG. 112 Two Layers Elevation Projection of the AMR Control Scheme of an Automated System
- FIG. 113 Three Layers Elevation Projection of the AMR Control Scheme of an Automated System
- FIG. 114 Dynamic Relationship Constraints Interface
- FIG. 115 AMR_Loop_Process Data Structures
- FIG. 116 AMR Message Header Format
- FIG. 117 ALI_Net Message Header Format
- FIG. 118 Plan Projection of an AMR Concurrent Application Control Process
- FIG. 119 Subloops of a Concurrent Application Control Process
- FIG. 120 High Level Control Loops Binding Supervisory and Concurrent Application Control Processes
- FIG. 121 High Level Elevation Projection of an AMR Supervisory Control Process
- FIG. 122 Compound Connections of Concurrent Application Control Processes
- FIG. 123 High Level Plan Projection of a Concurrent AMR Supervisory Control Process
- FIG. 124 Subloops of a Concurrent AMR Supervisory Control Process
- FIG. 125 AMR Overload Monitor
- FIG. 126 Loop Cycle Window Measurements
- FIG. 127 Internal structure of AMR Learning Controller
- FIG. 128 Elevation Projection of Model Estimation and State Prediction Procedure (The Impulse Response Ladder)
- FIG. 129 Elevation Projection of Model Estimation and State Prediction Procedure (The General Auto Regressive Ladder)
- FIG. 130 Elevation Projection of Model Estimation and State Prediction Procedure (The PreWhitening Ladder)
- FIG. 131 Elevation Projection of Model Estimation and State Prediction Procedure (The Optimum Dead Time Impulse Response Ladder)
- FIG. 132 Elevation Projection of Model Estimation and State Prediction Procedure (The Time Shifted, Compact Form Ladder)
- FIG. 133 AMR Performance Controller
- FIG. 134 Lower Level Composition of the AMR Performance Controller
- FIG. 135 Lower Level Composition of the AMR Fuzzy Control Engine
- FIG. 136 Fuzzy Performance Control Membership Functions
- FIG. 137 Control Rules of Loop_Response_Time (LRT) Measurements of Critical Loops
- FIG. 138 Control Rules of Predicted Loop_Response_Time (LRT) Measurements of Critical Loops
- FIG. 139 Control Rules of Loop_Load (LL) Measurements of Critical Loops
- FIG. 140 Control Rules of Predicted Loop_Load (LL) Measurements of Critical Loops
- FIG. 141 Control Rules of Loop_Service_Time (LST) Measurements of Critical Loops
- FIG. 142 Control Rules of Predicted Loop_Service_Time (LST) Measurements of Critical Loops
- FIG. 143 Control Rules of Loop_Resource_Utilization_Level (LRUL) Measurements of Critical Loops
- FIG. 144 Control Rules of Predicted Loop_Resource_Utilization_Level (LRUL) Measurements of Critical Loops
- FIG. 145 Business Management ALI_Nets
- FIG. 146 Lower Level Composition of Business Management ALI_Nets
- FIG. 147 Value Cost Trade-off Analysis
- FIG. 148 AMR Value Cost Analysis
- FIG. 149 AMR Parallel Simulation Engine
- FIG. 150 Three Basic Categories of Work Break-Down Structures
- FIG. 151 Work Break-Down Structure Relationships
- FIG. 152 A Set of ALI_Net Dynamic Graphs
- FIG. 153 A Set of Business Control Graphs
- FIG. 154 Overview of the Pull Down Menus of AMR Tools
- FIG. 155 Architecture Categories Rules
- FIG. 156 Category Specification Rules
- FIG. 157 Project Region
- FIG. 158 Project Instances Data Base
- FIG. 159 Project ALI_Net Specification
- FIG. 160 ALI_Net Type Specification
- FIG. 161 Object Region
- FIG. 162 Object Type Specification
- FIG. 163 Object Instances Data Base
- FIG. 164 Storage Region
- FIG. 165 Storage Type Specification
- FIG. 166 Storage Instances Data Base
- FIG. 167 Pipe Region
- FIG. 168 Pipe Type Specification
- FIG. 169 Pipe Instances Data Base
- FIG. 170 Loop Region
- FIG. 171 Loop Type Specification
- FIG. 172 Loop Instances Data Base
- FIG. 173 Model Manipulation
- FIG. 174 Containment Relationship Constraints
- FIG. 175 Association Relationship Graph
- FIG. 176 Association Constraints Specification
- FIG. 177 Loop Relationship Constraints
- FIG. 178 Architecture View Types
- FIG. 179 Region View Types
- FIG. 180 Structural Analysis Reports
- FIG. 181 Dynamic Analysis Reports
- FIG. 182 Real System Planning
- FIG. 183 Specify Geographical Constraint of Infotronic & Organizational Objects
- FIG. 184 Plan Projection of a Node Configuration Example
- FIG. 185 Specify Geographical Constraint of Mechatronic Objects
- FIG. 186 Plan Routing & Connectivity of Mechatronic Objects
- FIG. 187 AMR Supervisory Control
- FIG. 188 AMR Monitoring_Views Controller
- FIG. 189 AMR Learning Controller
- FIG. 190 AMR Performance Controller
- FIG. 191 AMR Configuration Controller
- FIG. 192 AMR Security Controller
- FIG. 193 AMR Reliability Controller
- FIG. 194 Equipment Scheduling
- FIG. 195 Personnel Scheduling
- FIG. 196 ALI_Net Scheduling
- FIG. 197 Real System Identification
- FIG. 198 AMR Project Management
- FIG. 199 Plan Projection of the AMR Tools Kit
- FIG. 200 Plan Projection of an AMR Knowledge Controller
- FIG. 201 Plan Projection of the Tool Kit M Schemas
- FIG. 202 Plan Projection of Inter-connections Between M Schemas
- FIG. 203 Isomorphic Plan Projection of Inter-connections Between M Schemas
- FIG. 204 Elevation Projection of a Multi_Level Architecture
- FIG. 205 Elevation Projection of a Set of Multi_Level Schemas
- FIG. 206 Components of a Multi_Level Schema
- FIG. 207 Unfolded Projection of a Set of AMR Knowledge Controllers
- FIG. 208 Plan Projection of a Homogeneous Set of AMR Tools
- FIG. 209 Plan Projection of the Partially Distributed Knowledge Controller Tools Kit
- FIG. 210 Elevation Projection of the Operational Model of an AMR CDE Knowledge Controller
- FIG. 211 Operational Model of an AMR COE Configuration and Installation
- FIG. 212 Multi_Level Integration of UML Models
- FIG. 213 Heterogeneous Tools Schema Relationships
- M Language a tools-supported formal geometric visual language
- Formal language means that the language not only specifies syntactically valid visual sentences, but also provides semantic and mathematical interpretation of these sentences. This interpretation is used to analyze, verify, validate, control, and adapt the run time behavior of the developed system.
- Geometric language means that the language not only provides generalized icons for annotating system objects, but also associates a geometric region with each object. These regions are geometrically arranged to specify the spatial elevation and plan projections of 1) static system structure constraints such as containment, association and connection relationships of the system components, 2) dynamic system structure constraints such as performance, reliability, and security constraints of the interconnected system components, and 3) the implications of static and dynamic system constraints on the system data flow, control flow, and state transition relationships.
- Visual language means that the language is not only diagram-based, but is also generalized icon-based.
- generalized icon we mean that the icon of each region provides the dual representation of a physical part (the pictorial image) and a logical part (the meaning).
- the M language is used to specify a new class of systems engineering tools called Adaptive Model-Reference (AMR) tools. These tools are specified using the following four sets of procedures as shown in FIG. 1 :
- AMR Architecture Specification and Analysis Procedures These procedures provide rules used by system architects and designers to construct, adapt, and verify the blue prints of the integrated system design using the geometric language of this invention as shown in procedures 1-5, and 9-10.
- AMR Development and Manufacturing Procedures are used by developers of information objects and fabricators of physical objects to create objects specified in the blue prints of the system architecture design.
- AMR Planning, Scheduling, and Enactment Procedures provide rules used by business managers and system operators to plan business operations, schedule resources, enact, control and sustain the run time behavior of systems specified using the geometric language of this invention as shown in procedures 5, 7, 8, 9, and 10.
- AMR Business Management Procedures These procedures provide rules used by project managers to construct, adapt, and verify the blue prints of the business missions performed by real system operations as shown in procedure 6.
- Geometric models of this invention are constructed using a cellular display called the M cellular display.
- This display is virtual, tessellated, and wraparound. It is virtual and tessellated using equilateral triangle tiles such that there are no gaps and no tiles overlap as shown in FIG. 2 .
- the wraparound requirement implies that the display is tiled such that when a point is guided off the left side of the display, it appears at the same height on the right side. Similarly when a point moves off the top of the display area, it reappears at the corresponding position on the bottom.
- the virtual cellular requirements imply that the display is partitioned into cells where each cell is composed of two adjacent triangular display tiles as shown in FIG. 2, and each cell represents a unique segment in the system spatial state grid.
- a set of one or more triangular display tiles are used, in the following procedures, to construct primitives of the formal geometric visual language of this invention.
- the symbol ⁇ is used to define the geometric region of an abstract or a real system, its named mechatronic or infotronic component objects, or the named transformation functions performed by the component objects.
- a real system is defined as a set of one or more physical processes, such as sensors, energy transformation, material and information transfer equipment; data processors and their associated software; and human operators and system users.
- the system region ⁇ specifies the boundaries of a geometric area which contains the set of geometric regions of all of it's component objects. It follows that the system geometric root region ⁇ is a container of a set of object regions ⁇ where system component objects reside. An object, whose region consists of a single tile, is called a visually atomic object if it's internal structure is not visually specified. An object which is not visually atomic is called a visually compound object.
- an object region ⁇ of each visually specified object, is composed using four special types of geometric regions called atomic regions. These regions are called an operation region; an attribute or a resource region; a referential attribute region; and a public interface region where, as shown in FIG. 3 :
- An operation region ⁇ is an active geometric region used to specify the set of object operations called methods or member functions required to access object variables.
- the set of operations performed by an object defines the operational interface or message protocol of the object.
- An attribute or a resource region ⁇ is a passive geometric region used to specify the set of attribute types (or variables), attribute values of a place, such as computer memory, where these attributes reside, or physical resources, such as an operational facility or a hardware processor, required to house and execute object functions.
- a referential attribute region ⁇ is a passive geometric region used to specify the set of referential attributes which specify linking, embedding, and containment relationships with other objects.
- a public interface region ⁇ is a passive geometric region used to export the named object message protocol. In other words define the list of the named object operations, their signature and type of attributes provided by the container object and its contained objects.
- a loop connections duct, a tube used to house, represent, the set of loop connections supported by an object.
- each object region is composed of a set of one or more method regions as shown in FIG. 4 .
- each composition pattern resides within the minimum containing rectangle allocated to the root object region, called the initiator object region.
- all methods share the same set of object attributes then all method regions are adjacent to a single object resource region as shown in FIG. 4 .
- each resource region can be decomposed into a set of one or more resource regions as shown in FIG. 5 .
- each composition pattern resides within the minimum containing rectangle allocated to the root resource region, sometimes called the initiator resource region.
- method regions may be folded or unfolded.
- FIGS. 6 and 7 By applying the tessellated wraparound requirements of the virtual display area, as specified in procedure 2, isomorphic geometric representations of folded/unfolded method regions are constructed as specified in FIGS. 6 and 7.
- FIG. 8 illustrates the folding/unfolding rules of the resource regions of an object
- FIG. 9 illustrates the folding/unfolding rules of the resource regions of the public interface of an object.
- the unfolded patterns of FIGS. 6 to 9 can be equally represented by the unfolded pattern shown in FIG. 10 .
- Application of these rules to the folding and unfolding of the real numbers set is shown in FIG. 11 .
- FIG. 12 An atomic connection which is bipartite, directed, and token based as shown in FIG. 12 .
- These connections are constructed using the Edge symbol ⁇ .
- the bipartite requirement disallows the connection between two regions of the same type i.e. only a ⁇ region can only be connected to a ⁇ region and vice versa.
- Two basic types of atomic connections are defined.
- the first type of connection called staged connection as shown in FIG. ( 12 - a ), is normally used to specify the flow of material or energy resources consumed or generated by system physical objects where the outputs of the producer object are deposited into a shared storage resource region where they are subsequently used by the consumer object.
- the second type of connection called pipe connection as shown in FIG.
- FIG. ( 12 - b ) is used to specify the communication between a set of collaborating objects. Pipe connections are established using public interfaces of producer objects. These connections are used to represent push and pull communication models as shown in procedure 5.2.1. As shown in FIG. ( 12 - c ), an equivalent Petri Net can be created for FIGS. ( 12 - a ) and ( 12 - b ). FIG. ( 12 - c ) lacks an explicit representation of different communication semantics captured in FIGS. ( 12 - a ), ( 12 - b ), and ( 73 ). See procedure 5.2.1 for further details.
- plan projection and elevation projection Two types of geometric projections, called plan projection and elevation projection, are constructed for a multilayered stack of objects as follows:
- the elevation projection is constructed by assigning, for each layered object, FIG. ( 13 - a ), an object region ⁇ and an interface region ⁇ as shown in FIG. ( 13 - b ).
- Each object region is recursively contained within the geometric region of the higher level container object as shown in FIG. ( 13 - c ). For a set of n layered objects, this process is repeated n times.
- the resource region of each object may be encapsulated as shown in FIG. 14 . This process can be recursively applied until each resource region represents passive data structures, i.e. not abstract data structures which are not encapsulated by an object.
- FIGS. 13 and 14 provide visual representation of containment relationship constraints between layered objects. Other types of constraints such as association and value constraints are further incorporated in the system visual specification as shown in FIGS. 43 and 114
- System specifications are usually developed using traditional functional decomposition and structured design methods or state of the art object oriented methods listed in FIG. 16 . These methods provide procedures for the specification of a system's underlying static and dynamic models as shown in FIGS. 17, 18 and 19 .
- At least four types of graphs are used by structured design and object oriented methods.
- the first type called a tree graph, is used to specify the hierarchical function and data structures of the designed system.
- the second type called a state transition graph, is used to specify various system states (operating modes) and state transitions triggered by internal and external events handled by the system.
- the third type called a data and a control flow graph, is used to specify the input/output data and control flow relationships between the system transformation functions.
- the fourth type a Petri Net graph
- M model a single geometric graph
- a resource region ⁇ is allocated to each child vertex, at each level, of the hierarchical data structure tree graph.
- an optional generalized icon may be associated with the geometric region.
- Child regions, at each level, are aggregated into a parent compound data structure resource region.
- a function region ⁇ is allocated to each child vertex, at each level, of the hierarchical function structure tree graph.
- an optional generalized icon may be associated with the geometric region.
- Child regions, at each level, are aggregated into a parent compound function region.
- a resource region ⁇ is allocated to each event e i in the state transition graph and a function region ⁇ is allocated to each action.
- an optional generalized icon may be associated with the different types of geometric regions.
- a resource region ⁇ is allocated to each data flow D i in the data flow graph and a function region ⁇ is allocated to each function F i .
- This rule in conjunction with procedure 2 rules, are applied to the data flow graph associated with each system mode. As shown in FIGS. ( 23 - a ) and ( 24 - a ) an optional generalized icon may be associated with the different types of geometric regions. These rules generate the unfolded geometric representation of the data flow graphs of each system mode as shown in FIG. ( 23 - b ) and ( 24 - b ).
- the data flow graphs of each system mode can be combined in a single token based Petri Net graph as shown in FIG. ( 25 - a ).
- This figure assimilates information provided in FIGS. ( 23 - a ) and ( 24 - a ).
- FIGS. ( 23 - b ) and ( 24 - b ) can be assimilated to generate FIG. ( 25 - b ).
- This figure provides an unfolded geometric representation of data flow information for both system modes.
- FIG. 26 Sixth, procedure 2 rules are used to generate a single integrated geometric graph as shown in FIG. 26 .
- This graph integrates the folded geometric representation of all information provided in FIGS. ( 20 - 25 ).
- FIG. 26 provides visual integrated view of static and dynamic system structures.
- processing logic of each function, or object method can be specified using the set of logic primitives shown in FIG. 27 .
- Each generalized icon of these primitives has the trio representation of a physical part (the pictorial image), a logical part (the meaning) and a process part (the computation).
- FIG. ( 28 - b ) illustrates how FIG. 27 primitives can be used to generate geometric representation of the program fragment shown in FIG. ( 28 - a ).
- Procedure 2 and 3 rules are used to develop the geometric plan and elevation projections shown in FIGS. ( 29 - 32 ) respectively.
- FIG. 29 provides a plan projection of the set of AMR procedures and tools presented in this invention. Plan projection of these procedures and tools is shown in FIG. 30 . These tools are supported by two knowledge controllers whose plan projections are shown in FIG. 31 . Plan projections of FIGS. ( 29 - 31 ) are complemented with the elevation projection shown in FIG. 32 .
- An External System region ⁇ is defined. This region contains all automated systems, physical processes, and organizations that are not included within the boundary of a real system under investigation. As shown in procedure 5.2.2, the XS region to construct the external design control model, called the operational requirements architecture model of a real system as described in procedure 5. This model specifies and controls the behavior of business operational activities performed by external human objects. These activities provide a framework for specifying the desired functional and behavioral specification of the operational requirements of a distributed real system RS under investigation. Objects contained within the external system region are called external system objects. The multi-layered plan and elevation projections of these objects can be generated using procedure 2 rules.
- a Real System region ⁇ is defined. This region contains all objects, within the stated system boundary, that function to satisfy the desired system behavior. This region is used to construct an internal system design control model, called the design control architecture model as described in procedure 5. This model is used to specify and control the behavior of activities performed by various real system objects. Objects contained within the internal system region are called internal system objects. The multi-layered plan and elevation projections of these objects can be generated using procedure 2
- the resource regions contain all the state variables, and resources, of the XS and S regions respectively.
- an integrated system evolution model is specified using an iterative system map called the M iterative map as shown in FIGS. 35 and 36.
- an integrated model we mean that the model can be applied to represent the evolution of both the container and contained system objects at all levels of system aggregation and abstraction.
- System evolution is defined as both spatial and time evolution of systems. Spatial evolution means that, at each point of time t, a system has a geometric design structure which records the evolutionary processes used to create the observed physical state and information state structure at time t.
- Time evolution means that evolution of the system state, its static and dynamic design structure during development, maintenance and run time operations. As shown in FIGS. 35 and 36 :
- i(t i ) and o(t i+1 ) specify the values of the system input and output variables at event times t i and t i+1 respectively.
- the set of system operations F and G are specified using a mixture of discrete event and discrete time dynamical system models. For many application systems these operations are usually time variant, nonlinear and distributed which gives rise to complex system behavior. Adding to these complexities, these systems are often subject to a sequence of events that contains surprises and unpredictabilities such as variations in system loads and equipment aging. These events result in unexpected failures, not to mention hidden system design and software implementation errors. All these factors combined lead to failure to control the system design, it's development, and it's run time behavior. To help management of system complexities, the core subject of this invention is to provide system designers and users with analysis, display, design control, and run time tools that enable the design of systems that can be adapted to meet their desired system requirements (see procedures 5, 6 and 7).
- FIG. 37 is used to specify the design control architecture of a real system as shown in FIGS. 38, 39 and 40 where:
- the spatial and time evolution of the system design structure is specified using a sequence of time indexed instances of the system model where each element in this sequence is a snapshot of the system state space structure at a specified time instant.
- the spatial “state space” projection of each element in the sequence is specified using the following three types of models as shown in FIGS. 39 and 40 :
- a minimum static architecture model This is an M model which provides an integrated geometric representation of classification, association and aggregation relationships between system objects.
- a minimum static architecture model is created using procedure 5.1.
- An integrated architecture model This is an M model which is used to partition a system dynamic architecture into a minimal set of independent, observable, controllable subsystems called Adaptive Loop Information Nets (ALI_Nets).
- ALI_Nets Adaptive Loop Information Nets
- An AMR design control scheme This scheme is used to adapt behavior of a real system ALI_Nets to meet desired behavior as specified in the operational requirements architecture model.
- the real system AMR design control scheme is created using procedure 5.3.
- the sequence of time indexed M models shown in FIGS. ( 35 - 37 ), are used to specify the time evolution of the system during all phases of the system life cycle.
- Two types of time dependent changes are captured by the system time projection: system structure changes and changes in the values of system state variables specified by the system design structures.
- the time projection of the latter type of changes is specified using the ALI_Net state graphs described in procedure 5.1.2. Information captured by these diagrams is used in procedure 5.3.3.2 to control the system run time behavior.
- Control oriented design of adaptive integrated architectures is carried out using procedures 5.1 to 5.3.
- This procedure consists of two methods.
- the first method described in procedure 5.1.1, is used to construct M models of the static semantic primitives of objects. These primitives are aggregated to specify an integrated static architecture model.
- the second method described in procedure 5.1.2, uses the aforementioned model to specify the minimum static architecture model.
- a ⁇ geometric region is allocated for each object type depicted on the object relationship model by a rectangle as shown in FIG. ( 41 - a ).
- a ⁇ geometric region is allocated for each set of one or more directional object type relationships (role or associations). Each relationship is depicted on the object relationship diagram example by the symbol as shown in FIG. ( 41 - b ).
- association object region ⁇ is embedded within the ⁇ relationship region as shown in FIG. ( 41 - c ).
- an optional generalized icon is associated with each geometric region. This icon is used to associate the geometric region with the original graph type semantics as shown in FIG. ( 41 - c ).
- Each attribute set is encapsulated by a set of object methods. It follows that the public interface of each object can be partitioned into three sub-regions called the application function interface, the attribute value constraints interface, and the association relationship constraints interface. These regions are used to invoke object methods responsible for the specification and enforcement of system constraints, see FIG. ( 42 a-c ). As shown in FIG.
- three types of object attribute value constraints are defined: range constraints which are statements used to specify the lower and upper bound of the values of object variables, enumeration constraints which define the enumerated list of allowed values and their number, and relationship constraints which define the correct relationship between two or more object attributes.
- range constraints which are statements used to specify the lower and upper bound of the values of object variables
- enumeration constraints which define the enumerated list of allowed values and their number
- relationship constraints which define the correct relationship between two or more object attributes.
- three types of object association relationship constraints are defined: participation constraints which define the number of times an object instance of an object class can participate in a connected relationship, co-occurrence constraints which define the number of instances of different objects that can exist together in a relationship, and cardinality constraints which define the maximum number of instances of an object class.
- the first category of models are object classification models based on the semantic primitives “Kind_Of” or “Is_A” object relationships. These relationships are used to specify class inheritance relationships. Geometric representation of these models is carried out using the following procedure:
- a ⁇ geometric region is assigned to each method of the derived class shown in FIG. ( 44 - a ).
- the region of each inherited method is embedded within a dashed ⁇ geometric resource region. Subsequently this dashed resource region is embedded within the derived class regions as shown in FIG. ( 44 - b ).
- the use of a dashed line indicates that the method region is visually atomic and not partitioned into lower level methods.
- the second category of models are hierarchical models based on the semantic primitives “Part_Of”, “Has_A”, and Knows_A” object relationships. These relationships are used to specify the aggregation and composition of objects using a set of component objects.
- a ⁇ geometric region defined by a single triangular display tile, is allocated to each lowest level leaf of each tree branch shown in FIG. ( 46 - a ).
- the lower level object component regions are aggregated to form the geometric region of the higher level aggregated object as shown in FIG. ( 46 - b ).
- the compound object region is defined by the smallest equilateral containing triangle of its component regions.
- each compound object region may be reversed to decompose each compound object region into its component object regions.
- This region may consist of a single display tile for visually atomic objects and multiple display tiles for visually compound objects as specified in procedure 2.
- the component object regions are dragged to be totally embedded within the internal attributes region of the container object as shown in FIGS. ( 47 and 48 ). Since “Has_A” and “Knows_A” represent attribution types of class relationships between containers and component objects, their regions are geometrically contained within the attributes region of the container object. To demonstrate that component objects in “Knows_A” relationships have different life cycles from their containers, geometric projection of component objects are displayed with dashed lines as shown in FIG. 48 .
- FIGS. ( 41 - 49 ) Object association, classification and composition geometric primitives, shown in FIGS. ( 41 - 49 ), are combined to enable the specification of an integrated static architecture of real system objects as shown in FIG. 50 .
- the static architecture provides the necessary foundation for specifying the dynamic system design control scheme as shown in procedures 5.2 and 5.3.
- R, S are scaling parameters along x and y coordinates
- Theta, Phi are rotation parameters relative to x and y coordinates
- E, F are translation parameters in the x and y directions
- Prob is the probability of selecting an iterated function rule
- Each set region can be further partitioned to specify sub-resource regions allocated to each attribute, some times called variables as shown in FIG. ( 54 ). If O(A) is the set of all object attributes, then O(A) can be partitioned into two subsets namely Primary_Attributes O(P_A) set and Derived_Attributes O(D_A) set such that:
- the tuple [O(P_A), G(D_A)] defines for each object k, an orthogonal Attributes Basis O(A_B).
- This basis is a minimal attributes generator such that if an element is excluded from it, then the generated set of attributes will be a proper set of O(A).
- the minimum state of each object is defined by the set of values assumed by the orthogonal set of all object attributes O(P_A) at some instant of time t.
- These attributes specify the object state space vector O(S, t) where:
- a unique axis is associated with each object attribute (variable).
- This construction creates a planner representation of n dimensional space models. Since each of these variables resides in a resource region of the object model, it follows that associated with each axis there is a unique resource region.
- the object state O(S, t) at a given instant of time t k can be specified by a directed polygon graph, called an Object State or Loop State graph, as shown in FIG. 55 .
- This graph depicts the values of the state variables of an object or a loop, at any given instance of time t, by connecting the temporal values of object state variables displayed on the attributes axis sets as shown in FIGS. ( 55 - a, b ). Each of these axes may be scaled to display the values of numerical and/or linguistic variables.
- Temporal evolution of object state is represented using the time indexed object state graphs shown in FIG. ( 55 - b ). Each of these graphs displays the lower and upper alarm limits and out of control limits for each system loop as shown in FIG.
- ALI_Net state graph The state of each ALI_Net at a given instant of time is specified by a directed polygon graph, called an ALI_Net state graph.
- This graph specifies the directed interconnection between two main sets of variables (resource regions) namely input/output state variables observed by external systems and internal state variables.
- Loop state graphs may be aggregated to display the aggregated behavior of a set of ALI_Net loops. Overlay of the current and desired state graphs specifying desired and current performance states provides an effective visualization of any deviations of object behavior. This deviation can be automatically detected to initiate necessary notifications and corrective action as shown in procedure 7.5.
- object attributes may be specified as crisp variables, such as input numerical information from sensor measurements and output numerical information to device actuators, or fuzzy variables such as input/output linguistic information meaningful to humans.
- fuzzy logic the two types of information are combined into a common frame work where a given object attribute value may belong to one or more sets of linguistic variables as shown in FIG. ( 56 - a, b ). The degree of membership in each of these sets is determined using member functions. The values of each of these functions are real numbers in the interval [0. 1].
- FIG. ( 57 - a ) illustrates three member functions used to map numerical values of a crisp variable, say temperature measurements, onto three linguistic variable, say Cool designated by the blue color, Warm designated by the black color, and Hot designated by the red color. This mapping calculates for each numerical value, its degree of membership in various member functions as shown in FIG. ( 57 - b ).
- Object functions are classified based on their role and how they were generated.
- Generation-based classification partitions object functions into an Inherited Functions O(Ih_F) set and an Intrinsic Functions O(In_F) set.
- Role based classification partitions object functions into two sets:
- Control_Functions O(C_F) set Each element of this set can:
- Application_Processing_Functions O(A_P_F) set Each element of this set can:
- Calculate object attribute values may be used by a control module or by other application process modules.
- the set of all object functions O(F) is partitioned into two subsets namely Primary_Functions O(P_F) set and Derived_Functions O(D_F) set such that:
- the tuple [O(P_F), G(D_F)] defines for each object k, an Object Function_Basis O(F_B).
- This basis is a minimal function generator where, if an element can be excluded from it, then the generated set of functions will be a proper set of O(F).
- O is the set of all static object basis.
- the orthogonal attributes basis of an aggregated object is the union of the attributes basis of all of its component objects as shown in FIG. 58 .
- the orthogonal representation of an aggregated three object system specifies shared application function attributes, referential attributes and control attributes.
- This procedure consists of two methods.
- the first method described in procedure 5.2.1, enables the specification of a minimum dynamic architecture structure using ALI_Nets. These nets are used, in the second method described in procedure 5.2.2, to specify an integrated architecture model of a real system.
- Use Case diagrams to specify or characterize the behavior of a whole application system together with one or more external actors that interact with the system.
- Object Message or Collaboration diagrams to illustrate the objects and links that exist just before an operation begins and also the objects and links created (and possibly destroyed) during the operation.
- Requirements not explicitly captured by existing design and analysis methods include: real-time constraints, performance constraints; contextual constraints like the necessity to coexist with existing systems; resource constraints of target system; reliability constraints; integrity constraints; security constraints; and safety constraints. Without an integrated architecture model which captures and integrates how the system design will not violate these constraints, it is impossible to design adaptive systems which can meet their desired operational requirements.
- ALI Adaptive Loop Information
- Each of the traditional system design views, used by structured design or object oriented tools, is specified as a separate geometric, blueprint, overlay.
- the geometric aggregation of these overlays defines the integrated system graph in a manner similar to that shown in FIG. 26 . This process is carried out such that the geometry of system objects and their relationships, for each of the system views, maintains an invariant relationship to their spatial relationship on their parent integrated graph.
- ALI_Net a set of proper subsystems called ALI_Nets.
- Each ALI_Net can be independently configured, tested, modified, maintained and controlled to meet changing system requirements where:
- Each ALI_Net must satisfy the following conditions:
- Each ALI_Net has explicit user (outer directed) goals clearly delineated in the system operational architecture model, and implied design (inner directed) goals. The two sets of goals should be clearly linked in the integrated architecture model. Furthermore, the architecture of each ALI_Net should contain the three essential elements of control, application processing functions, and information feedback.
- Each ALI_Net is dynamic where, through execution (motion), component objects of the ALI_Net become interrelated and can interact.
- Control Condition System dynamics are controlled using a set of one or more, interacting ALI_Nets loops.
- Each ALI_Net is specified using three types of object loops: Application Processing loops, Control loops, and Diagnostic loops as shown in FIGS. 60, 61 and 62 .
- Application processing loops are triggered by event types generated by external systems including system users. Processing of these events will result in generating desired application system outputs.
- Each application processing loop specifies the sequence of information flows and state transitions required to generate application system products under normal operating conditions. Diagnostic loops recognize fault events, analyze these events to identify causes of malfunctions and necessary corrective action.
- Control loops monitor operational performance of application processing loops and diagnostic loop results to adapt system structure, its configuration and the scheduling of its resources to achieve desired operational objectives of the real system.
- the first category is called physical object control loops. These loops are the traditional automatic control loops used in the process control, sensors, and manufacturing industries to regulate the behavior of the subsystem physical objects (physical devices).
- the second category is called information object control loops. These loops are used to monitor and adapt the dynamic behavior of the subsystem information processing objects to changes caused by the system operational environment. Specification, design, and run time enactment of information subsystem loops is a principal objective of this invention.
- Each object loop component of an ALI_Net is viable during an identifiable period of time, called the loop cycle time, as shown in FIG. 35 .
- Viable implies that during the loop cycle time, loop operations can be performed without the need for exchanging information with the system outer environment.
- Each ALI_Net has a structure for patterned behavior such that it demonstrates stability and continuity. Stability means that the system attains steady state in its environmental field and internally. But, a steady state does not mean static.
- observation process used to monitor system aspects which are significant to the particular user type.
- Information exchange during the observation process provides the means by which the observer develops a better comprehension of the system.
- Various observation model types are further aggregated into a minimum observable and controllable model supported by a minimum static object model as shown in procedure 5.3.
- each ALI_Net associated with each proper subsystem provides a mechanism for capturing evolving design details of the static/dynamic relationships of the proper subsystem components. It follows that at each phase of the life cycle the components of each proper subsystem and their static/dynamic relationships, can be readily identified, visualized, tracked, and isolated from other proper subsystems.
- An object_loop specifies the interconnection between a set of one or more “loop terminal input” resource regions, and a set of one or more “loop terminal output” resource regions. These sets include the set of persistent internal system resources. These resources are maintained by the ALI_Net control modules to ensure the reliable fault tolerant operation of the specified subsystem. Input and output edges connecting loop body with its terminal resource regions are called external loop edges. All other loop edges are called internal loop edges. These edges are used to specify required connection between internal systems.
- Cyclic input set implies that the set of all loop terminal inputs, specifying the external information required to perform loop functions, are input to the subsystem once at the beginning of a complete cycle. Two subsets of loop terminal inputs are specified: the first subset is the subset of inputs provided by external system objects and the second subset is retrieved from the system internal persistent data base.
- Cyclic output set implies that a complete cycle of the system produces internal interactions and any element of the set of loop terminal outputs can be expressed as constants at the end of the loop cycle.
- Two subsets of loop terminal outputs are specified: the first subset is the subset of outputs transmitted to external system objects and the second subset is stored in the system internal persistent data base.
- ALI_Net a set of coupled object loops are aggregated to form an ALI_Net.
- ALI_Nets are subsequently aggregated to compose the System Design Control Scheme. Aggregation operations are carried out using the cascade and parallel aggregation structures shown in FIGS. ( 64 - 67 ).
- each object_loop may be specified as a closed or an open loop; an object loop that begins and ends with the same region is called a closed loop; a loop which does not satisfy the closed loop condition is called an open loop, see FIG. 63 .
- loop category is designated as an Application Processing loop, a Fault Diagnostic loop or a Control loop.
- An Application Processing loop or a Fault Diagnostic loop is determined by the presence or absence of control actions required to regulate the quality of system services provided by the system. As shown in FIGS. ( 63 - a, b ), L k and L k — d are closed control loops because system operators and automated system control actions are dependent on measurements of system outputs.
- L k is a closed loop, it is not a control loop because the control action necessary to maintain the quality of the processing loop products/service is not dependent on loop L k outputs. Closed process loops provide the basic structure for the sequential nesting of a set of two or more object_loops (subsystem fragments) into subsystem_loops.
- L i is an open control loop, FIG. ( 63 - c ), because system operators and internal system control actions are independent of system output values.
- Cascade loop aggregation structures These structures are used to specify the sequential nesting, loop chaining, of a set of two or more loops such that the terminal inputs of each loop, excluding the first loop, are set by external systems using values of the terminal outputs of the preceding loop as shown in FIGS. ( 64 and 65 ).
- Parallel loop aggregation structures These structures are used to specify a concurrent set of upstream subsystem loops, loop decomposition, triggered by a set of cyclic terminal inputs, with a down stream set of subsystem loops.
- the terminal inputs of the down stream fragments are set by external systems using the combined values of the terminal outputs of the upstream fragments as shown in FIGS. ( 66 and 67 ).
- Mixed loop aggregation structures These structures are used to specify the sequential nesting of a set of two or more loops where the internal structure of each of these loops may have a parallel aggregation structure.
- each set of coupled object_loops is aggregated into an ALI_Net structure.
- coupled loops we mean object loops whose components satisfy one or more of the above coupling conditions.
- the set of regions shared between the component loops of an ALI_Net specifies behavioral dependencies between the coupled set of object loops.
- each object loop L n as an ordered set of multilayer component loops where L nj designates the jth layer component of the loop L n as shown in FIGS. 68 and 69.
- Each layered component loop is triggered when the services of an object belonging to the designated layer are invoked.
- the annotation of various sub-loops of the multi-layered distributed application systems is optionally displayed using the following convention:
- ⁇ Edge_Identifier> is defined using loop communication constructs as shown in FIGS. ( 73 - 77 ).
- object_loops may fork or branch only at an object or a method region ⁇ . If the loop fork condition is an AND then all output edges are annotated with the identical loop Id name as the input edges of the loop. On the other hand if the loop branching condition is an OR then the loop ID name of each possible output edge is augmented with an additional unique sub-loop id name.
- each layered component loop by an ordered set of pipe connections between system objects allocated to the designated layer as shown in FIG. 69 .
- Each of these system objects may be implemented using run time system environments such as Microsoft's COM objects or Object Management Group's CORBA objects.
- FIG. ( 70 - a, b ) each COM or SOM object is represented by a geometric region within which the component objects are embedded as shown in FIG. ( 70 - c ).
- An object public interface region contains a list of methods (e.g. vtable pointers) supported by the interface as shown in FIG. 71 .
- all interactions between the component objects of a loop occur only by invoking object operations, and objects execution only affect system resources allocated to the object.
- Two types of object interaction structures are defined:
- Operation chaining structure occurs when an operation on one object triggers the invocation of an operation on another object This chained operation may in turn cause another operation to be invoked (see loop L n of FIG. 72 ).
- Operation decomposition structure occurs when an operation on one object triggers multiple operations on other objects.
- the result is a hierarchical processing tree with the owner object performing the initial operation at the root of the tree; each subordinate operation must be completed before its superior operation can finish, and coordination among subordinate operations may be required (see loop L j of FIG. 72 ).
- Synchronous mode with the invoked object operation returns Result or Error.
- Asynchronous mode with the invoked object operation returns Result or Error.
- asynchronous communication is represented by a directed edge from the invoking object to the object containing the invoked object operation where the sequenced symbols ⁇ are used to specify communication and execution order.
- synchronous communications are represented by a bi-directed edge which represents the synchronous return condition of Result or Error (if any).
- Asynchronous and synchronous pipe connections are specified using the following four basic communication constructs. These constructs provide visual geometric representation of loop communication semantics as follows:
- Basic_Communication construct shown in FIG. ( 74 - d ) provides an aggregated geometric representation of the two basic interactions of the connected objects with the communication binding object.
- Loop_Fork_Communication construct shown in FIG. ( 75 - d ) For a named loop, the Loop_Fork construct generates two or more concurrent computations as specified in the signature of the send request. As shown in FIG. ( 75 - d ), edges specifying the trigger of the two forked computations O q and O r are annotated with the identical loop annotation to the input edge to the O p computation.
- Loop_Branch_Communication construct shown in FIG. ( 76 - d ) For a named loop, the Loop_Branch construct triggers only one of two or more concurrent computations. Selection of which computation to trigger is specified in the signature of the receive request. As shown in FIG. ( 76 - d ), the annotation of each output edge is concatenated with a sequential index number specifying the subloop name.
- Loop_Join_Communication construct shown in FIG. ( 77 - d ) For a named loop, the Loop_Join construct is used to specify the combine of two or more upstream computations performed by concurrent system objects into one concurrent down stream computation. As shown in FIG. ( 77 - d ), the O d computation will halt until all input edges with the same loop annotation are enabled. This implies that the O d will not perform any loop L i functions until both M k and M s conditions are enabled. On the other hand the L m functions will be immediately triggered by the enabling of the M k condition.
- FIG. 81 The loop wiring diagram of the two object loops system of FIG. 72 is shown in FIG. 81 .
- the sequence of loop connections is specified at the message invocation connection points and the list of component objects are monotonically sorted by their layered id.
- the multi-layered loops of each ALI_Net shown in FIG. 69, can be arranged to display the isomorphic ALI_Net dynamic graph shown in FIG. 83 .
- This new type of graphs enable the visualization and analysis of the subsystem dynamics specified by an ALI_Net.
- loop harmonics at each layer are computed by the superposition of the harmonics of its component loops at the lower layer.
- ALI_Net the set of metrics used to measure the operational effectiveness of the proper subsystem represented by the ALI_Net, predict the impact of resources allocation or design changes on quality of service provided by the proper subsystem and its financial results. As shown in FIG. 84, four major categories of metrics are used:
- Quality of Service/Customer Profile Metrics These metrics measure customer satisfaction relative to competitors, customer retention, market share gain, customer complaints, etc.
- Products/services quality metrics measure compliance to industry standards, creation of innovative products, etc.
- Financial Metrics These metrics evaluate the cost/profit of delivering products or services created by the proper subsystem. Financial metrics include unit cost of each resource type.
- Resource Utilization Metrics These metrics include human resources metrics which measure human labor requirements and skills; equipment resources, computer hardware and software resources.
- Operational Metrics These metrics include process cycle time, idle time, wait time, throughput rates, work in progress, inventory levels, defect rate, error rates, resources levels. These metrics evaluate the efficiency of transforming process inputs (raw materials) into physical products. Other operational metrics include information metrics which evaluate the value of information generated by the proper subsystem.
- ALI_Net Business Tracking Graph as shown in FIG. 85 .
- this figure there is an overall system desired operating region and a set of ALI_Net actual performance regions. Each of the latter regions specifies the contribution of the specified net to the overall performance of a real system.
- deviations of measured variables from desired system behavior can trigger automated run time system control actions of the AMR control schemes as shown in procedure 5.3 or system operator control actions.
- the latter type of control is facilitated by the business tracking control graphs. As shown in procedure 6, these graphs provide system operators and business managers with visual criteria for identifying and correlating the causes of both technical and/or financial performance problems.
- ALI_Net model functions and input/output signals represented by ALI_Net messages, have a meaning. This implies that the meaning of each aggregated message and each function should correlate in some sense with that which is within the cognitive models of the human sender and receiver.
- ALI_Net operational requirements architecture model should be consistent, i.e. match, the cognitive model of a class of human system users.
- cognitive model we mean an image of a segment of the real world which is of interest to the observer where all remaining segments are called the environment. This model consists of a set of assertions, that must be related to the real world where each assertion consists of a subject related to the matter of the statement, and a predicate which positively qualifies the subject.
- an observable model we mean that a system is observed by one or more external user types.
- External users include all automated systems and human users that are not included within the system boundary. These users reside in the External System region named XS as shown in FIG. 34 .
- XS External System region
- each user object type there exists a set of ALI_Net loops, each of which specifies a dynamic relation between an n-array of system objects (O m , . . . , O z ) and the user object type.
- each ALI_Net defines the observation process used to observe certain aspects of the system under investigation.
- the ALI_Net loop terminal input/output regions provides the means by which the observer develops a better comprehension of the system.
- comprehension is developed using the external user's own semantic framework, as defined by his or her conceptual model, which acts as a substratum space for the information contents of the ALI_Net message flow between the system and a given user object type.
- ALI_Net Since an ALI_Net is defined only with respect to a given user type, called an observer, who observes that part of the whole system which he/she wants to investigate and/or manipulate, then each part of a system may be observed by one or more user types. It follows that multiple ALI_Nets may be associated with the same dynamic segment of a given system. Each of these nets must be tailored to match the human conceptual model of a given user type as shown in FIG. 86 .
- L is the set of all ALI_Net loops required to observe the system under investigation
- each ALI_Net is generated using elements of the S(OL_B) basis.
- an ALI_Net provides an invariant structure to evolving system design and implementation details.
- Each design control loop is an object loop which:
- each ALI_Net loop is specified to match the conceptual model of a loop user type.
- Each conceptual model consists of a set of assertions.
- Each assertion consists of a subject and a predicate.
- the “subject/predicate” provides a description of the data attributes of an object as it appears in reality. Relationships between these data entity types are captured by object relationship models, semantic network models or entity relationship models. Access to different types of information referenced by these models is specified using a special type of loops called Information Access Loops (IAL), see FIG. 90 .
- IAL Information Access Loops
- An information access loop consists of two loop segments called “Forward and Backward” loop segments.
- the forward segment is specified by a sequence of one or more functions (representing a connected set of entity relationships).
- the backward segment is specified by a sequence of one or more functions, each of which is an inverse of the forward loop functions.
- the data base can be viewed as a set of stored functions where one function is defined for each entity attribute. Given an entity identifier as a parameter, each function returns the value of the appropriate attribute. Given a data base, with entity types E 1 , E 2 , E 3 , . . . , E n , a relationship between E 1 and E 2 specifies a function which returns an entity occurrence of type E 2 when given the attribute value of an entity occurrence of type E 1 .
- Geometric representation of information access loops are constructed according to the following rules as shown in FIG. ( 90 - c ):
- Entity types which are depicted, on the object relationship models, semantic network models or entity relationship models, by a rectangle, are represented by the geometric region symbol ⁇ . These regions can be hierarchically decomposed, into component regions representing lower level subtypes, using the construction rules of procedure 2.
- Entity or object type relationships (or associations) depicted on the relationship diagrams by the symbol ⁇ are represented by the geometric region symbols ⁇ .
- An information access loop is specified by an ordered set of edges connecting a set of ⁇ geometric regions. These loops specify the relationship between an n-ary relationship describing the association among n set of entities.
- the information access loops of an entity relationship model can be further encapsulated into an object relationship model as shown in procedure 3.
- design implementation loops code by binding design control loops to a programming language and a given object class library.
- Each design implementation loop is an object loop.
- the syntactic design/implementation specification of this loop is generated using a selected programming language grammar.
- the integrated architecture specified using the above procedure defines two major categories of application objects namely Mechatronic objects and Infotronic objects as shown in FIG. 91 .
- each of these objects is a container object whose structure is specified using “Has_A” and, or “Knows_A” relationships with a selected components of the three multi layer stacks of the system infrastructure objects.
- Infrastructure objects are specified, designed and manufactured in accordance with the selected open system interconnect reference model.
- This model called the technical reference model architecture, defines the rules and regulations i.e. protocols that govern interconnection and interworking among layered system objects.
- FIG. 92 three categories of physical system resources are encapsulated by the three layered stacks of system information objects:
- the first category of physical resources includes intra-node computer devices such as discs, displays, and tapes. These resources are managed by the multilevel stack of data processing controllers consisting of device controllers (e.g. disc controllers), device managers (e.g., file managers), and supervisory data processing managers (e.g. distributed data base managers).
- device controllers e.g. disc controllers
- device managers e.g., file managers
- supervisory data processing managers e.g. distributed data base managers
- the second category of physical resources includes inter-node communication devices such as communication channels. These resources are managed by the multilevel stack of controllers consisting of communication controllers, communication protocol control managers, and supervisory network managers.
- the third category of physical resources includes material or energy transformation devices such as chemical reactors, heat exchangers or radar antennas. These resources are managed by the multilevel stack of plant controllers consisting of discrete time controllers such as proportional integral derivative algorithms, plant event managers which compensate for system nonlinearities and saturation effects, and supervisory equipment mangers.
- Lower layer objects of each stack are used to regulate the dynamic behavior of the stack physical objects.
- Network and computer physical objects are managed using discrete event algorithms or protocols.
- equipment physical objects are regulated using control algorithms of broad applicability such as a PID algorithm.
- the parameters of these algorithms are adjusted to values that will result in an optimum closed-loop response of the physical objects.
- This type of continuous control can be applied when environmental disturbances result in a small change of the value of the physical process parameters such as its energy.
- the performance of the controller will degrade with time. Therefore to maintain good performance, the controller parameters must be adjusted from time to time.
- Higher layer objects of each stack contain lower level objects and provide additional discrete event algorithms.
- discrete event algorithms are used to control startup, shutdown, and failure recovery of system physical and information processing objects. Other functions include control of the generation, dissemination, storage, and retrieval of distributed system information.
- discrete event algorithms are used to compensate for the non-linear and time varying nature of physical objects.
- each stack of objects induces an ordering with respect to the time scale; specifically, the statistical mean period of the control loop action tends to increase as we proceed from a lower to a higher level of the control system hierarchy.
- elevation and plan projections of the three infra structure stacks can be developed as shown in FIGS. 93 and 94. Both projections can be integrated using the geometric cellular structure shown in FIG. 95 .
- the fractal structure of the application processing scheme encapsulates the hardware resources as shown in FIG. 96 .
- This figure provides an example of three concurrent user objects, executing on a two hardware processors system. As shown in FIG. ( 96 a-c ), the two hardware processors region is totally contained within the three objects resource region. Different views of the software/hardware processing scheme can be generated using the Region Display Setup options of procedure 7.
- the above rules can be applied to generate a geometric representation of systems whose architecture is specified by a stack of layered objects at each node.
- the geometric regions of the integrated system static/dynamic architecture at each time instant t are mapped on the physical space required to house system objects such as memory for computer implemented objects or the physical space occupied by physical objects such as sensors, or equipment.
- the physical space is represented by the Euclidean or Riemann geometry. This mapping is carried out as follows:
- each object region is folded into a multi-dimensional tetrahedron, octahedron, dodecahedron, or icosahhedron structure which is mapped onto the Euclidean/Riemann “Multi_Node” physical space grid and the memory space grid within each node as shown in FIGS. 99 and 100.
- This mapping is carried out using procedure 2 folding/unfolding rules. Mapping operations are supported by tools specified in procedure 7. These tools enable system designers to allocate object instances to various system nodes where a node is defined as a shared set of physical memory regions. Code compilation tools assign memory regions to various elements of the virtual system grid.
- the Euclidean three dimensional space represented by the Cartesian coordinate (x, y, z) is partitioned into a three dimensional set of cells as shown in FIGS. 100 and 101.
- each object may occupy a set of one or more cells in a single or multiple planes of the three dimensional physical space.
- Each of the physical space cells is identified by a unique set of latitude and longitude parameters.
- infotronic and mechatronic objects models created using procedures 5.1 and 5.2, are used by system planners, configurators and operators to: (see FIG. 102)
- Plans of a real system are constructed using the planning process shown in FIG. 103 where:
- an ALI_Net operational architecture model of desired business missions is constructed using procedure 5.2 and procedure 7 tools. Instances of each ALI_Net specified in the operational architecture is created using tools described in procedure 7.
- the geographical allocation of mechatronic and infotronic objects is specified by dragging each object, and/or a specified set of its ALI_Net segments, onto the three dimensional cellular space as shown in FIG. 104 .
- Routing, by Euclidean position, of each mechatronic object position is specified by an initial position, an end position, and an intermediate set of way points. Processing conditions of the specified ALI_Net segments at each routing point are monitored and used by the AMR scheduling algorithm to control the motion of the mechatronic object.
- AMR scheduling algorithms specify geographical constraints associated with the routing of mechatronic objects using the three dimensional cellular space shown in FIG. 105 . These constraints are used by the AMR scheduling algorithms to generate a pre-mission position routing plan such as those shown in FIG. 105 or use these constraints to automate and adapt the motion of the infotronic objects using run time sensor measurements.
- AMR algorithms associate with each cell a number which represents the time, distance or fuel cost associated with arriving to the end position from the referenced cell. During run time the AMR scheduler uses this information to invoke the movement of the object to the neighboring cell with the lowest value. This movement will be carried out if and only if the processing conditions of the object ALI_Net segments at the given set of cells are satisfied.
- procedure 7 tools use object transportation functions, shown in FIG. 106, to implement routing plans of mechatronic objects. Similarly routing of system messages between mechatronic and infotronic objects is realized using procedure 5.2.1 as shown in FIGS. 107 and 108.
- use procedure 7 tools to generate a prioritized list of human and mechatronic object instances to perform required business missions. Use this list to generate required schedules.
- created schedules can be directed, implemented, monitored, controlled and adapted by the run time tools of procedure 7.
- An AMR control scheme of the automated information system components of a real system is constructed as follows: see FIGS. ( 110 - 112 )
- an AMR control scheme of an automated information system is composed of a set of analogue/digital controllers which manage interfaces with external physical objects, a set of views each of which is tailored to the semantic requirements of a specific end users type, and adaptive view controllers which regulate the update of user type views using the AMR supervisory control model.
- the AMR control scheme of the automated information system is constructed using two types of system control models: an AMR Concurrent Application Control Scheme, as shown in procedure 5.3.3.1, and an AMR Supervisory Control Scheme, as shown in procedure 5.3.3.2.
- the first scheme is constructed in the manner described in section 5.2.1.
- the second scheme is constructed using the distributed system ALI_Net Supervisory Control loops.
- the two schemes are embedded in FIG. 111 model to compose the automated system AMR control scheme as shown in FIG. 113 .
- Dynamic relationship constraints of this model are specified using the following set of attributes as shown in FIG. 114 :
- Software/Hardware allocation (e.g. node name, processor name, and concurrent process names allocated as resources required to execute the named loop). Values of these attributes may be set by a human operator or dynamically assigned by the AMR_Configuration_Controller during run time operation.
- Access rights such as access rights for each user type and each instant of a user type.
- Access right values include No_Access or Access to a named ALI_Net, a component object loop, a named object_operation or a data structure. Access rights are further constrained to deny making any changes to the system configuration, quality and performance control parameters.
- Desired communication system semantics such as atomic broadcast, causal broadcast or group broadcast protocols.
- these protocols use the system ALI_Net graphs as the context graph required to preserve the partial ordering of messages exchanged among a collection of concurrent processes in the presence of communication and processor failures.
- Loop invariants which state common preconditions on all loop operations. Invariant conditions on the loop state are established by the object_initialisation operation and are preserved by subsequent loop operations including failure recovery operations.
- Performance Control attributes These attributes are used to specify the service time distribution of system component objects, the invocation frequency of each ALI_Net loop, each of its object loop components, and the desired response time distribution. Furthermore each loop can be classified by system configurators as critical, essential, or nonessential and each can be assigned a time based value function. Critical loops are those with hard response time deadlines which must be achieved under all operating conditions. Essential loops are those with soft response time deadlines, which if not achieved will not cause a catastrophic system failures. Nonessential loops are those with response time deadlines, which if missed will not affect the system in the near future such as long term data recording. A loop category determines its share of available system resources. For each category three types of performance control attribute values are defined: required, measured, and predicted. These attributes are measured, predicted and used to control quality of delivered products and services as shown in procedure 5.3.3.2 and procedure 7.
- loop parameters specified in the last step are accepted and used by the distributed set of the system AMR Supervisory controllers to create the AMR Loop_Process data structures shown in FIG. 115 . These structures are used by the AMR controller objects of each concurrent application control process as shown in procedure 5.3.3.2.
- Inter_Process_Loop_Connectivity_Graph This graph specifies the “enable/disable” state of each ALI_Net as well as the interconnections between the terminal input/output regions of various ALI_Net_Process_Segments required to execute each object_loop of each ALI_Net.
- the Inter_Process_Loop_Connectivity_Graph is used by the AMR_Reliable_Communication controllers and the AMR_Activation_Reply_Forward controller.
- Intra_Process_Loop_Connectivity_Graph This graph specifies each subset of each ALI_Net graph (called ALI_Net_Process_Segment) allocated to the named process. This segment specifies interconnections between intra-process objects, some times called component objects of the container object i.e. process, required to execute each object_loop of each ALI_Net allocated to the named process.
- the Intra_Process_Loop_Connectivity_Graph is used by the AMR_Base_Scheme controller.
- Reliable_Communication_Parameters These parameters specify causal ordering options.
- Loop_Control_Flags Six AMR flags are defined:
- each AMR concurrent application control process contains two sets of objects; concurrent controllers object set and application processing object set.
- the following set of concurrent controllers objects use the AMR_Loop_Process data structures, shown in FIG. 115, and the AMR_Message_Header, shown in FIGS. 116 and 117, to interconnect and synchronize the application processing objects within each process as well as between concurrent processes.
- AMR Reliable_Communication Controller When an application processing object is invoked, this controller uses the AMR_Message_Header, the Inter_Process_Loop_Connectivity_Graph, and the Reliable_Communication_Parameters to check if processing of the received message can be handled by the process and that the message is received in compliance with the casual ordering specified in the Inter_Process_Loop_Connectivity_Graph. IF the received message was sent to the wrong process, THEN the requested invocation is rejected, red edge 1 - a and the supervisory configuration and security controllers are notified ELSE transaction manager services, e.g. CORBA, COM/OLE, etc. services, are used to lock the application processing object.
- ELSE transaction manager services e.g. CORBA, COM/OLE, etc. services
- the invocation is handed over to the security controller, black edge 1 - a .
- the requested invocation is returned to the input process queue or is rejected, red edge 1 - a.
- AMR Security Controller uses the Security_Control (process Loop_Objects Access Right) data structure to determine if the invoker, at this stage of the aggregated ALI_Net loop, is authorized to invoke all object operations of the named loop or can only invoke a named subset of these operations. In addition this controller invokes the decryption functions using the private key assigned to the current session assigned to the current Object_Loop. If the request is authorized then the request is inserted in the process Loop_Object Invocation Queues, black edge 1 - b , else the request is rejected, red edge 1 - a.
- Security_Control process Loop_Objects Access Right
- AMR Activation Controller This controller uses the Loop_Objects Invocation Queues and the Intra_Process Loop Connectivity graph to activate the thread manager to create a new thread and link it to the requested loop operation.
- the Reply_Forward function sends operation results to invoker in compliance with the invocation service protocol.
- the Reply_Forward functions provide the necessary wrapper and invoke communication object, see FIG. 91, to route messages to other process objects in accordance with the Inter_Process Loop Connectivity graph. Invoked objects may reside on the same or different stations of the distributed system.
- AMR Concurrency Controller This controller manages the synchronization of shared resources and management of the process invocation queue. It creates, deletes, suspends, resumes, and schedules object threads. Scheduling of thread objects is determined using AMR message header, process state, and the set of object preconditions (predicates) specified in the Intra_Process Loop Connectivity graph
- AMR Reliable_Configuration Controller This controller accepts process configuration control parameters from the AMR supervisory controller and uses these parameters to set the AMR Loop_Process data structure parameters shown in FIG. 90 .
- the AMR Reliable_Configuration controller restores from secondary memory all process persistent data for each object loop allocated to the named process.
- all edits to named persistent data used by various object loops are automatically stored on secondary memory by the object manager encapsulating the named persistent data.
- an AMR configuration controller uses monitored ALI_Net communication loads to edit the AMR Loop_Process data structures. This is carried out such that processes with heavy message communication are automatically migrated to reside on the same hardware node. This will result in reducing loading of the communication network infrastructure.
- AMR_Monitoring Controller In accordance with the AMR Supervisory Controller Process requests, this controller collects and dispatches Process and Loop state information to the Supervisory Controller Process, see FIGS. 120 and 121.
- the AMR Monitoring Controller In accordance with the AMR Supervisory Controller Process requests, this controller collects and dispatches Process and Loop state information to the Supervisory Controller Process, see FIGS. 120 and 121.
- the AMR Monitoring Controller In accordance with the AMR Supervisory Controller Process requests, this controller collects and dispatches Process and Loop state information to the Supervisory Controller Process, see FIGS. 120 and 121.
- Recorded data includes invocation time of operating system services, attribute values of invoked services such as the identification name of sender or receiver object, service time used by the operating system to execute desired service and the program counter identifying the state of the concurrent object invoking the system service.
- Use recorded data to identify the concurrent object automata i.e. internal processing control loops of the concurrent object.
- This specification is derived at the granularity of interfaces of the concurrent object with the operating system.
- the object automata identification algorithm reduces recorded data to generate statistical estimates of the service times elapsed between each ordered pair of states of the concurrent object. These states are specified at the points of interactions with the operating system.
- the object automata identification algorithm may be invoked during run time when the operating system service calls are invoked. In this invention it is assumed that the necessary data required to identify the concurrent object automata will be collected using run time monitoring services provided by operating system vendors.
- Pipe connections are used to bind distributed concurrent system objects into dynamic loop structures as shown in FIG. 122 .
- the fractal structure of object communication model see FIG. 73, is aggregated with the concurrent process structure to form the aggregated concurrent object communication model shown in FIG. 122 .
- An AMR Supervisory Control scheme is constructed as follows:
- the first set of loops designated by the blue color, are used to monitor the system physical resources; configure and control the allocation of these resources to application concurrent processes.
- the second set of loops designated by the red color, are used to monitor, configure and control the allocation of each application_specific processing loops to one or more concurrent processes. These processes may be allocated to one or more nodes of the distributed hardware system.
- the second set of loops control the scheduling of available system resources to serve the run time operational needs of monitored concurrent processes.
- the third set of loops designated by the black color, are used to coordinate and synchronize the multi-node set of AMR supervisory control processes.
- loops broadcast desired control requests, of a named set of ALI_Net loops, to all AMR supervisory control processes residing on each system node involved in the processing of the named loops. If a performance exception is raised about a named ALI_Net, then coordination control requests are exchanged between peer AMR supervisory control processes.
- each AMR supervisory control concurrent process has two sets objects, see FIG. 123, the concurrent controllers object set, as shown in FIGS. 118 and 119, and the supervisory controllers object set. Control roles played by the supervisory controller objects are shown in FIG. 124 as follows:
- this monitor uses the Node Process and Loops state data structure to update the AMR Temporal_State data structure.
- This data structure maintains state information about each ALI_Net loop and its implementation by the distributed system concurrent processes.
- Six major sets of variables are tracked by the monitor namely Loop_Response_Time, Loop_Response_Time_Remaining, Loop_Load, Loop_Service_Time, Resource_Utilization and Loop_Accuracy.
- the current value of the state variable and its estimated deviation, i.e. error, from a desired set point at the point of measurement is carried out using the Loop_Cycle time window specified in FIG. 126 .
- the time Duration of Loop_Cycle_Window C x for all x is set equal to the maximum of the Loop_Response Time_Desired for all loops.
- Loop_Response_Time (LRT) is used in the following procedure to compute the Loop_Response_Time_Set_Point for each loop_component_object O m of loop L n during the current Loop_Cycle C c
- Loop_Response_Time_Measured (L n , O m , C x , j) is the measured response time for the j th invocation of loop L n after the execution of object O m during the x th Loop_Cycle C x
- Loop_Load (LL) is used in the following procedure to compute the Loop_Load_Set_Point and Loop_Load_Measured for the current Loop_Cycle C c :
- Loop_Load_Measured (L j , C x ) (Total number of invocations of loop
- m(x) Number of loops used during the x th Loop_Cycle C x
- Loop_Service_Time (LST) is used in the following procedure is used to compute the Loop_Service_Time_Set_Point for each loop_component_object O m of loop L n during the current Loop_Cycle C c :
- Loop_Service_Time_Measured (L n , O m , C x , j) is the cumulative service time for the j th invocation of loop L n after the execution of object O m during the x th Loop_Cycle C x . Cumulative service time does include any wait time for availability of required resources.
- b Number of loop cycles included in the computation. Each cycle have the set of loops that are incorporated in the current cycle
- Loop_Resource_Utiliztion_Level such as Queue_Utilization, CPU_Utiliztion, Equipment_Utilization or Human_operator_Utilization levels is used in the following procedure to compute the Loop_Resource_Utiliztion_Set_Point (L n , R j , G k , C c ) of the resource R j allocated to the G k operational region to support the execution of loop L n during the current Loop_Cycle C c
- LRUL Loop_Resource_Utiliztion_Level
- Loop_Resource_Utiliztion_Measured (L n , R j , G k , C x ) Maximum utilization level of Resource R j during loop cycle C x
- m(x) Number of loops used during the x th Loop_Cycle C x
- Loop_Resource_Utiliztion_Set_Point (L n , R j , G k , C c ) ⁇
- Loop_Resource_Utiliztion_Measured (L n , R j , G k , C c ⁇ 1 ) ⁇
- Loop_Resource_Utiliztion_Delta_Error (L n , R j , G k , C c )/
- Loop_Resource_Utiliztion_Error (L n , R j , G k , C c )
- AMR Learning Controller As shown in FIG. 127, methods of this object accept as inputs time ordered crisp values of observed system state variables such as the four major set of variables tracked by the AMR_Overload_Monitor. For a given desired prediction distance, and the maximum prediction error which meet the desired quality metrics, the Model Estimation and State Prediction object estimate:
- Loop_Response_Time_Measured Loop_Load_Measured
- Loop_Service_Time_Measured Loop_Resource_Utiliztion_Measured.
- Loop measurements are collected from a single or multiple invocations of a given loop. In the single invocation case, at the end of execution of current object O m for the current invocation i of loop L x , the error prediction algorithm accepts as input the response time series
- O ⁇ O 1 , O 2 , O 3 , O 4 , . . . , O m ⁇ is the set of all objects executed in the i th invocation of loop L x
- the error prediction algorithm accepts as input the time series
- Loop_Response_Time_Measured (L x , O m , i ⁇ k ⁇ 1), . . . ,
- the AMR_Learning_Controller uses the dead time moving average ladder algorithm of this invention as specified in procedure 10.
- This algorithm enables the estimation of system model order and it's associated dead time parameters for non-linear systems with time varying properties. This means that the system delay can shift as a function of the system operating level.
- the powerful orthogonalization properties of the dead time moving average ladder algorithm enable the estimation of the probability limits associated with different prediction distances as well as the residual energy of the prediction error at different system orders.
- the dead time moving average ladder algorithm is reduced to the prewhitening ladder algorithm used in the seismic and speech recognition industries (Makhoul 1978, Riley 1972). Fractal representations of procedure 10 algorithms are shown in FIGS. 128 to 132 .
- AMR Performance Controller uses the ALI_Nets_Temporal_State data structure to generate Configuration_Control_Requests and Scheduling_Control_Requests required to adapt system behavior to meet desired performance requirements.
- the AMR performance controller object invokes the AMR Fuzzy Control Engine as shown in FIG. 134 .
- This engine is aggregated using the following component objects as shown in FIG. 135 :
- Update membership Functions object which enables the specification, editing, normalization and storage of the member functions of each linguistic variable in the ALI_Nets_Temporal_State data structure.
- the seven fuzzy labels EXCELLENT, V. GOOD, GOOD, OK, BAD, V. BAD, TERRIBLE are provided as shown in FIG. 136 . Shape, overlap, and number of membership functions can be overridden.
- Fuzzifier object which uses the set of ALI_Net Member Functions to compute the degree of membership of each ALI_Nets_Temporal_State crisp value referenced in the antecedent propositions of the ALI_Net rules specified in FIGS. ( 137 - 144 ).
- the ALI_Net_Correlator_Aggregator object which maps the fuzzy logic operations specified in the input fuzzy propositions of the ALI_Net performance control rules into output fuzzy propositions that are processed by the Defuzzifier object.
- the default set of the ALI_Net performance control rules are shown in FIGS. ( 137 - 144 ). This set is edited using information provided by the AMR overload monitor and the AMR learning controller.
- the ALI_Correlator_aggregator object uses:
- Standard minimum/maximum aggregation techniques to compute the maximum of the consequent fuzzy set and the solution fuzzy set at each point along their mutual membership function. This is followed by aggregating the set of consequent fuzzy sets using the fuzzy union operation; or the standard Additive Aggregation techniques to add the correlated consequent fuzzy set to the contents of the solution variable's output fuzzy region.
- Defuzzifier object which uses the aggregated result of output fuzzy propositions to compute the crisp value of the scheduling priority request conveyed to a specified resource's scheduler object or the crisp value of the configuration load shedding request conveyed to the system configuration control processes.
- AMR Configuration Controller This object disables the execution of nonessential, essential, and critical ALI_Net loops, in this order. Loops to be disabled are those identified in received Configuration_Control_Requests from the AMR Performance Controller. Duration of the disable period is determined by the duration time of the overload or malfunction system conditions which gave rise to conditions detected or predicted by the AMR performance controller. Enabling and disabling commands are carried out by invoking the AMR_Reliable_Configuration_Controller of different concurrent processes.
- ALI_Nets The purpose of the first set of ALI_Nets, called Business Planning ALI_Nets, is to integrate the customer into the design process of products and services.
- Product planning ALI_Nets involve three sets of functions: product positioning, market positioning, and corporate positioning. Design of these functions should be carried out using the Relationship Marketing approach advanced by Regis McKenna where:
- Product positioning functions determine how the company wants its product to fit into the competitive market
- Market positioning functions determine early customer advocates, reseller networks, distributors, third party suppliers, and journalists who control the flow of information and opinion.
- ALI_Nets should be supported by the second set of ALI_Nets, called AMR Product Development and Operation ALI_Nets. These nets are composed using the following four sets of loops: architecture specification and analysis ALI_Nets; “product/service” design and analysis ALI_Nets; product manufacturing and physical integration ALI_Nets; and product/service tailoring ALI_Nets.
- FIGS. 146 and 147 a value cost trade-off analysis is embedded in the very internal operation of each product development loop. This analysis ensures that product development activities are formulated, elaborated, connected, and synchronized with the product planning loops as shown in FIG. 147 . In this figure:
- the outermost loop architecture specification functions are used to generate alternative operational requirement architecture models for a proposed product concept. These models are used to estimate the technical feasibility, cost, and business value of each operational architecture model as shown in the next step of this procedure. Results of the value cost analysis are used to select the set of one or more operational architecture models to be further investigated.
- the middle loop product design functions use the selected operational architecture models to generate detailed integrated design control architecture models. These models are used to estimate the technical feasibility, cost and business value of each system design architecture model as shown in next step of this procedure. Results of the value cost analysis are used to select the set of one or more design control architecture models to be further investigated.
- the inner loop product manufacturing functions use the selected design control architecture model to generate integrated implementation architecture models. These models are used to: 1) estimate the technical feasibility, cost and business value of each system implementation option as shown in next step of this procedure; 2) automate the manufacturing of products using design automation tools.
- each of the above architecture models is specified by a set of ALI_Net loops such that each ALI_Net graph:
- Value metrics are used to resolve design trade off decisions. To achieve adaptive system goals, value metrics are used by the AMR system schedulers to manage the allocation of system resources to loop functions.
- Levels of interconnections include those between users and external system objects, between concurrent system objects, or between methods of concurrent objects.
- value cost analysis is carried out using the AMR Sensitivity Analysis tool.
- This tool is used to compute the operational performance of alternate architecture models.
- Using the AMR Sensitivity Analysis tool enable the evaluation of the impact of changes in the system design structure parameters, or available resources, on the system performance metrics. Examples of system performance metrics are response time, throughput, resource utilization, and resource queue levels.
- Design parameter changes include or its workload characteristics:
- Scenario generators describing the system environment interactions and inputs workload characteristics.
- the AMR Sensitivity Analysis tools retrieve from the AMR Knowledge Manager the set of architecture model alternative and their associated AMR_Loop_Process data structures. Each alternative is defined as a performance analysis experiment analyzed by the AMR Parallel Simulation Engine. As shown in FIG. 149, this engine is composed using two major objects, the Multi_Experiment Multi_Node Process Interpreter and the Multi_Experiment Multi_Node Kernel Interpreter.
- sensitivity analysis results for each ALI_Net of each product design alternative are displayed using ALI_Net Business Tracking graphs shown in FIG. 153 . These graphs provide a comprehensive summary of the values of the set of metrics used to measure the operational effectiveness and value of the system design.
- ALI_Net business tracking graphs and their associated Object/loop state graphs to identify bottlenecks of current operations or proposed system designs and resolve design trade off decisions.
- Each ALI_Net has an operational integrity of its own. Hence it delivers to the end user a useful function without compromising the long-term integrity of the system architecture when subsequent builds are delivered.
- the Object_Loop precedence graph, of each ALI_Net specifies coupling between system components and the order of integration of these components to create each Object_Loop and the set of coupled Object_Loops composing the designated ALI_Net.
- this integration may be carried out off-line by system developers or dynamically by the AMR run time systems.
- ALI_Net graphs are used to automate the generation of system integration and system acceptance tests. Each graph provides an operational definition of how system components should be assembled to meet different end user functional performance requirements.
- FIGS. 152 and 153 these graphs provide a seamless integration of information provided by the ALI_Net business tracking graphs of FIG. 85, and the ALI_Net project schedule graphs.
- the geometric regions can be curved and stretched to represent their time duration, their resource consumption, and their added value metrics. These metrics are displayed in FIG. 152 by unfolding the ALI_Net Business Tracking Graph shown in FIGS. 153 .
- Integrated business dynamics and business control graphs provide business executives with a comprehensive view of business performance, its operational value, its financial value measurement and how these measurements stack against the original goals. This information is used to make the necessary adjustments and upgrade of current business operations, and how these operations can be evolved to incorporate new products.
- FIG. 154 provides an overview of the pull-down menus supported by the following set of AMR tools:
- the text specification is primarily used to specify the internal design of visually atomic objects.
- the visual specification makes extensive use of the M language of this invention to specify and enact the configuration of visually atomic objects into adaptive computer based systems.
- the “Architecture Categories Rules” dialogue box shown in FIG. 155 which provides users the capability to:
- the “Category Specification Rules” dialogue box shown in FIG. 156 which provides users the capability to:
- Model category with default values ⁇ Entity_Relationship, State_Transition, Data_Flow, Colored_Petri_Net, Object_Relationship, Loop_Relationship ⁇ .
- Loop_Relationship category with default values ⁇ Processing, Control, Diagnostics ⁇ .
- Loop_Aggregation category with default values ⁇ Object, ALI_Net ⁇ .
- Object category with default values ⁇ Software, Hardware, Infotronic, Netronic, Mechatronic, Notronic ⁇ .
- Resource category with default values ⁇ Human, Physical, Material, Information ⁇ .
- the “Project Region” dialogue box shown in FIG. 157 which provides users the capability to:
- Project name is used to label the geometric region allocated to the project.
- a region is designated a “Root Region” if it is not contained within any other region of the same type.
- Region types are identified: system, external systems, storage resource and pipe.
- FIGS. Specify and edit categories of Object_Loop components of an ALI_Net and their model category as shown in FIGS. ( 159 and 160 ).
- a list of ALI_Net classes and their instances for each selected model category is displayed as shown in FIG. 160 .
- the “Object Region” dialogue box shown in FIG. 161 which provides users the capability to:
- Object name is used to label the geometric region allocated to the object If the object name was previously specified, then it will be automatically displayed in the Object region as shown in FIG. 161 .
- object class window View all system object classes of the selected category (object class window), attributes of each class (object attributes window) and its methods (Object methods window). These windows may display all object classes of the given project such that all list entries associated with the object region invoking the dialogue box are tagged when the dialogue box is opened. Or displayed lists may be limited to relevant information of the object region invoking the dialogue box as shown in FIG. 162 .
- Specify attributes and methods of object classes For visually atomic objects create or edit the code of object classes, methods and their attributes using the textual natural or programming language editor window as shown in FIG. 162 .
- the “Storage Region” dialogue box shown in FIG. 164 which provides users the capability to:
- Storage name is used to label the geometric region allocated to the storage resource If the storage resource name was previously specified, then it will be automatically displayed in the resource region allocated to the resource as shown in FIG. 164 .
- Resource attributes can be defined using abstract data types such as a constant, a decision or a routing table, an attribute table, a logical relationship, a relational relationship, or a probabilistic relationship. These modifications can be saved in project libraries specified using the dialogue box of FIG. 155 .
- This dialogue box enables viewing the list of loop names, and their types, associated with the named resource region.
- the “Pipe Region” dialogue box shown in FIG. 167 which provides users the capability to:
- Pipe name is used to label the geometric region allocated to the pipe resource. If the pipe resource name was previously specified, then it will be automatically displayed in the pipe region allocated to the resource as shown in FIG. 168 .
- Message classes Specify message classes, their attributes and values handled by the pipe resource and their encapsulating communication manager.
- Message classes define the external interface of objects connected to the named pipe class.
- Message class definition include:
- Object subreference specifying names of message generator, senders and receivers objects.
- Predicate subreference specifying one or more sets of the named message data entities.
- Time subreference specifying message generation, send, and receive times are examples of Time subreference specifying message generation, send, and receive times.
- the “Loop Region” dialogue Box shown in FIG. 170 which, for a selected set of one or more edges, provides users the capability to:
- Loop name is used to label the geometric region allocated to the loop. If the loop resource name was previously specified, then it will be automatically displayed in the loop region allocated to the resource as shown in FIG. 170 .
- a loop is designated a “Root loop” if all of its edges are not a subset of the loop edges of another loop.
- loop attributes include loop priority to specify the business criticality of a selected loop and the desired and actual performance parameters of the selected loop such as the loop execution frequency, loop response time, and loop throughput These parameters are used to generate display diagrams to visualize system dynamic evolution under different operating conditions as shown in FIG. 36 . As shown in procedure 5.3 these parameters are also used by loop enactment tools to control system behavior to meet user specified loop performance parameters.
- the loop branching conditions dialogue box enables the display of loop lists for each object selected from the Loop Object window, resources consumed, generated, or shared by the selected object to perform loop functions and the attributes of each of these resources. Entries from these lists are selected and used to specify the logical expressions of both input, output conditions and the annotation of loop edges as shown in FIGS. ( 74 - 77 .
- the message coordination dialogue box of FIG. 171 enables:
- the “Model Manipulation” menu shown in FIG. 173 This menu enables tool functions providing Aggregate, De-aggregate, Layer, Fold, and Unfold operations on the selected set of geometric regions using drag and drop operations. These operations are carried out on the selected geometric regions using rules specified in procedures 2, 3, 4 and 5 and their supporting figures.
- the “Architecture Constraints” menu which consists of the Object Relationship Constraint menu and the Loop Relationship Constraint menu as shown in FIG. 174 where:
- the Object Relationship Constraint menu provides the following two dialogue boxes:
- the “Association Relationship Constraint menu” dialogue box which for a selected one or more object regions provides users the capability to:
- the “Architecture View Type” dialogue box shown in FIG. 178, which provides users the capability to:
- This view may be restricted to a selected set of ALI_Net classes, and their component object_loops, executing on a selected set of nodes and processors.
- the “Region View Type” dialogue box shown in FIG. 179, which provides users the capability to:
- region display type by enabling/disabling the semantics and geometric icons of the selected region categories.
- the “Structural Analysis Reports” dialogue box shown in FIG. 180 which provides users the capability to:
- the “Dynamic Analysis Reports” dialogue box shown in FIG. 181, which provides users the capability to:
- the “Real System Planning” dialogue box shown in FIG. 182 enables users to plan the routing and connectivities between real system objects. To support these activities, three dialogue boxes are provided:
- the “Specify Geographical Constraints of Infotronic and Organizational Objects” dialogue box shown in FIG. 183 which provides users the capability to:
- Each cell in this display represents a geographical region in the Euclidean space of the physical grid and may contain a resource object or a container object.
- Each cell in this display represents a geographical region in the Euclidean space of the physical grid and may contain a resource object or a container object as specified in procedure 5.2.
- the “Information Control” menu provides the following six dialogue boxes:
- the “AMR Supervisory Control” dialogue box shown in FIG. 187 enables users to edit the configuration of the AMR supervisory controllers. To support these activities, six dialogue boxes are provided:
- the “AMR Overload Monitor View Controller” dialogue box shown in FIG. 188 which provides users the capability to:
- Default set consists of loop load, loop response time, loop service time, method service time, and loop accuracy.
- Monitor and persistently store a selected set of resources used by a selected set of one or more loops.
- the “AMR Learning Controller” dialogue box shown in FIG. 189 which provides users the capability to:
- the “AMR Performance Controller” dialogue box shown in FIG. 190 which provides users the capability to:
- Default set consists of temporal data structures, control rules, correlation/aggregation rules, and fuzzy control membership functions.
- the “AMR Security Controller” dialogue box shown in FIG. 192 which provides users the capability to:
- Select object loop category as processing, control, or diagnostics.
- FIGS. 195 The “Personnel Scheduling” dialogue box shown in FIGS. 195 which provides users the capability to:
- Select object loop category as processing, control, or diagnostics.
- the “ALI_Net Scheduling” dialogue box shown in FIG. 196, which provides users the capability to:
- Select object loop category as processing, control, or diagnostics.
- Select value function associated with the selected ALI_Net and/or Object_Loop This function is used by the ALI_Net scheduler.
- the “Real System Identification” dialogue box shown in FIG. 197, which provides users the capability to extract the dynamic behavior model for the selected set of ALI_Nets, Object_Loops, and their methods residing on a selected set of nodes and processors. This is carried out for the selected set of event types associated with the selected ALI_Nets.
- the “Project Management” dialogue box shown in FIG. 198 provides users the capability to:
- Select required value/cost project management displays to incorporate break down structure, project schedule, business tracking, and operations dependencies information for the selected architecture specification level.
- the four level categories, operational architecture, design, manufacturing, and tailoring, are specified as shown in procedure 6.
- Select display type as tabular or graphic. Graphic displays are generated for the selected information using displays of the type shown in FIGS. 150-153.
- the AMR Common Development Environment (CDE) knowledge controller and the AMR Common Operating Environment (COE) knowledge controller knowledge controllers are used to specify, encapsulate and manage the integrated ALI_Net meta model which captures the static and dynamic object relationships of the enterprise during all phases of the real system life cycle.
- CDE Common Development Environment
- COE AMR Common Operating Environment
- Each AMR knowledge controller is created using the concurrent processing control objects set shown in FIG. 123 .
- each Reliability Controller is constructed using four set of objects: Data_Integrity_Controller, Transaction_Correctness_Controller, Transaction_Atomicity_Controller, and the AMR_Structural_Integrity_Controller.
- the latter controller verifies and validates the structural integrity of the evolving enterprise wide operational/system architectures and its compliance with declared constraints and rules provided in this invention including object attribute and association constraints as shown in FIGS. ( 42 and 43 ); and structural constraints as shown in FIGS. ( 68 , 92 , 112 and 113 ) and their associated construction procedures.
- object attribute and association constraints as shown in FIGS. ( 42 and 43 )
- structural constraints as shown in FIGS. ( 68 , 92 , 112 and 113 ) and their associated construction procedures.
- FIGS. 201 to 209 where:
- Each of the M(k) schemas where k is BM, DM, ASA, SP, ASC, SI and OS, provides data base administrators with defined views used to regulate their respective tools access to shared and protected data.
- Each of the M(k) schemas is specified by a set of subschemas.
- Each M subschema specifies the M schema at a specified level of abstraction. The containment relationships between the different levels is shown in FIGS. 204 and 205.
- Each of the M subschema is defined using the set of a data definition dictionary, meta knowledge rules and ALI_Nets as shown in FIGS. 205 and 206.
- This set in accordance with procedure 5.2.2 rules, is defined at the given level of system abstraction over the shared set of active and passive object entities.
- Meta knowledge rules may restrict the allocation of the set of active/passive objects to a certain set of one or more architecture levels.
- the above set of M schemas are implemented using a set of distributed cooperating servers residing on each node of different sites of the distributed development systems.
- Two basic types of configurations can be realized.
- the first fully distributed configuration has no semantic filters as shown in FIGS. 207 and 208.
- each of the M schemas supporting BM, DM, ASA, SP, ASC, SI and OS loops categories is embedded within the boundary of tools supporting the specification, analysis, synthesis, design automation and sustainment of these loops. This implies a homogeneous design of the AMR tools kit where the underlying design of each tool is carried out using an M schema and its underlying M model design concepts.
- the second partially distributed configuration is shown in FIG. 209 .
- the tool kit is created using a heterogeneous set of tools whose interoperability is mediated using a set of semantic filters as shown in FIG. 213 . These filters mediate the underlying semantics of each tool with the integrated semantics of the CDE M schema and COE M schema
- the CDE knowledge controller is implemented by a set of distributed cooperating servers residing on each node of different sites of the distributed operational systems. These servers provide the product development/acquisition loop tool set with the following set of service capabilities as shown in FIG. 210 :
- architecture “integration level” models Define the number and user defined names of the set of architecture “integration level” models. As shown in FIG. 204, these models are used to specify business operations at different levels of abstraction from the specification of operational missions down to the blue print specification of the real system implementation and fabrication architectures. Examples of architecture “integration level” models are multi-site operational requirement architecture, multi-site functional architecture, multi-node network architecture, multi-processor hardware architecture, and multi-process software architecture.
- UML static model types are classification, association, and aggregation, object relationship models.
- UML dynamic model types are sequence, collaboration, statechart, activity, and implementation diagrams.
- Integration levels provide an ordered top-down hierarchical containment relationship between a given set of architecture models.
- Each of these items is an element of the real system Entity Relationship or Object Relationship models.
- Objects and resource types of each level may be hierarchically ordered.
- model types tailored to the semantic requirements of a specific end user type or a specific tool type.
- user types are project managers, system architects, object developers, and system operators.
- tool types are project management, cost analysis, requirements analysis, architecture specification, capacity planning, design simulation, reverse engineering, code generation, and test automation.
- the AMR COE knowledge controller is implemented by a set of distributed cooperating servers residing on each node of different sites of the distributed operational systems. These servers provide business operations with the following set of service capabilities as shown in FIG. 211 :
- the first type of kit is created using a homogeneous set of tools
- the second type of kit is created using a heterogeneous set of tools.
- a homogeneous set of tools we mean that each tool is designed to implement the underlying semantics of the ALI_Nets as specified by the design concepts, data structures, and procedures of this invention.
- a heterogeneous set of tools we mean that each tool was not designed to implement the M model design concepts but nevertheless can provide some required system specification, analysis or implementation functions.
- the second type of tools kit consists of a heterogeneous set of tools.
- Each of these tools can be an off-the-shelf commercial tool which can provide some of the functions required to implement the integrated design concepts, data structures, and procedures of this invention. Interoperability of these tools requires the specification of a semantic filter, i.e. information schema, for each tool.
- An integrated architecture of real systems has a self-similar or a self-affine fractal design structure as shown in FIGS. 35, 36 , 51 , 52 , 62 , 94 , and 97 .
- This structure is used to specify: 1) the static and dynamic binding, i.e. integration, of system components to form Infotronic, Mechatronic and Netronic objects, and 2) the dynamic binding of these objects to create adaptive operational system architectures.
- a useful description of a given system architecture is the fractal dimension of the system's spatial structure.
- Mandelbort provides a novel application of Mandelbort's ideas to evaluate the spatial structure of software intensive system architectures. Specifically this invention:
- SON(L n ) number of self-affine component objects specified at the n th level of the fractal structure of the static architecture.
- DON(L n ) number of self-affine ALI_Nets specified at the n th level of the fractal structure of the dynamic architecture.
- DOS(L n ) scale factor used to generate DON(L n ) components
- the spatial and time evolution of the system design structure is specified using a geometric system iterative map as shown in FIGS. 35 and 36.
- This map specifies a time indexed sequence of instances of the system architecture model. Each element in this sequence is a snapshot of the system state space structure at a specified time instant and the state of the system at each time instants is specified by the values of an ordered set of variables xj which reside in various passive regions of the M model of a real system.
- an architecture complexity is measured using entropy metrics of the set of ALI_Nets used to compose a given architecture.
- Justifications for selecting entropy as an architecture metric are:
- Each ALI_Net specifies an architecture partition which can be independently configured, tested, controlled, maintained and modified.
- Each ALI_Net defines the set of relations between system elements that operate as a constraint on the behavior of the system variables.
- OL(m,j) [x(j, 1), x(j, 2), . . . , x(j, n j )].
- n i number of occurrences of the i th possible value of OL(m, j)
Abstract
This invention specifies physics-like computational models called M models. These models enable the specification and design automation of an integrated architecture of a real system. A new class of adaptive systems engineering tools called Adaptive Model-Reference (AMR) tools, supports the M computational model. AMR tools are used to visually specify the integrated architecture model of a real system, assess it's value, and automate the static and dynamic binding of it's model components into adaptive systems. These systems can be adapted during system development to compensate for requirement changes and design errors, and during run time operation to compensate for unanticipated operational system conditions. AMR tools enable the verification and validation of adaptive real system designs built in compliance with a declared enterprise wide technical architecture. Architecture components can be specified using AMR tools or can be imported into the AMR tool set. AMR tools are specified using an open system architecture built as extensions to open system development environments, such as Microsoft Foundation and OLE, and run time system environments such as Microsoft Windows or Java Object Request Brokers (ORB).
Description
This application does not claim the benefit of prior patent applications. Relevant prior art is referenced in the section “Background of the Invention”.
This invention relates to open development and run time environments of computer based systems, integrated system architectures, adaptive fuzzy systems, fractal geometry, and formal geometric computer languages.
In recent years, real time systems used in the services, process control, manufacturing, and military industries have grown into complex software-intensive systems composed of aggregates of physical processes, hardware processors, communication networks, software systems, human operators, and users. The following factors contribute to the inherent complexity of a complex system (Athans 1987, Varaiya 1993):
Distributed processing: A complex system requires a wide variety of physical communication interconnections. Distribution of its application functions is dictated by geographical distribution of user locations, economy of design, or high levels of processing loads.
Distributed databases: A complex system has many distributed databases which require stringent control algorithms for data integrity, transaction correctness, transaction atomicity, reconfiguration, and concurrency.
Real-time constraints: A complex system has real-time constraints which cannot be exceeded without causing severe system malfunctions. The vulnerability of real-time systems imposes adaptability requirements on their design and run time operation where system functions may be dedicated to a processor or allowed to migrate among different processors. This entails trade-off analysis of software complexity, reliability, and dynamic load balancing.
Large number of sensors: A complex system may be monitoring thousands or millions of distributed sensors with distributed functions for fail-soft operation, self-diagnosis, self-simulation, and self-correction. The time evolution of these sensors is subject to input/output timing and synchronization problems within the physical processes and their environment.
Large number of variables: A complex system is a strongly interacting multivariable system where a change in one input variable produces a change in many other variables. Input variables are almost always statistical and time variant.
Malicious and accidental interruptions: A complex system may be subjected to criminal activities, jamming of communication lines, or the partial destruction of any of their elements. Significant loss of human life, destruction of equipment, and loss of valuable information may result from malfunction of the sensor instrumentation, the processor hardware, or software.
Human-machine interactions: A complex system performance depends on the interaction between humans and machines performing together. Determination of the proper boundaries separating machines from human functions in a hazardous system environment does not remain static during the system life cycle.
Since the functional performance and reliability of complex systems depends strongly on their software design, major intellectual and financial investment has been directed to the development of tools including object-oriented methods, open programming environments, and life cycle development processes. Effective application of these tools to develop and sustain complex systems is limited by the lack of display methods and tools for the geometric specification and design automation of software systems. In the software world, it is generally acknowledged that the difficult part of building software intensive systems is in the requirements specification, design and testing of the conceptual construct underlying the system, and not in the labor of coding it and testing the fidelity of the generated code (Brooks 1987). This conceptual construct is the set of interlocking concepts: data sets, static and dynamic relationships among data items, algorithms, and invocation of system functions. Major causes of these difficulties are:
Invisibility and unvisualizability problems of software. These problems arise because it is currently perceived that software is not inherently embedded in space and as such has no ready geometric representation in the way that land has maps, a three dimensional physical object has an elevation, plan and side view projections, or a mechanical part has a scale drawing. The unvisuability of the software impedes the process of design within one mind and severely hinders communication among minds.
Complexity problems of software. These problems arise because of the very large number of software elements, states assumed by these elements and the nonlinear interaction between these elements. Technical complexity gives rise to communication problems among team members, which lead to product flaws, cost overruns, and schedule delays.
Changeability problems of software. These problems arise because the software product is embedded in a cultural matrix of applications, users, laws, etc. These may change continually and their changes force change upon the software product.
Conformity problems of software. These problems arise because of the many arbitrary human institutions and systems to which the software interfaces must conform.
The above problems are not resolved by traditional structured design tools or state of the art object oriented tools (Champeaux 1992, Desmond 1999). Both sets of tools fail to provide the necessary mechanisms for the specification, design automation, and test of the conceptual construct of real systems. When functional decomposition and structured design tools are employed several graphs are used to represent data and program hierarchical structures, data flow, control flow, and system state transition. When object oriented tools are employed several graphs, such as Class, Use case, Sequence, Collaboration, and State diagrams, are used to represent object inheritance, object relationships, flow of data, flow of control, patterns of dependency, time sequence, and data base structure. The current generation of both structured design and object oriented design tools suffers from a number of disadvantages:
They do not provide mechanisms for the visual integration of the different types of graphs used to specify object inheritance, object relationships, flow of data, flow of control, patterns of dependency, time sequence, and data base structure. Each of these graphs has different syntax and semantics. For any real system of a significant size, the lack of visual integration mechanisms hinders human assimilation, inspection and analysis of the logical construct underlying multiple views of a specified system.
Syntax and semantics of their graphs do not capture critical aspects of the system operational constructs such as system performance constraints, system security constraints, system reliability constraints, and system fault tolerant constraints.
Syntax and semantics of their graphs do not capture critical aspects of the system static and dynamic configuration constructs such as the geographical allocation of system resources to system nodes, and scheduling of system resources to meet evolving operational system requirements.
Their graphs do not provide visual geometric enforcement of system design semantics such as the spatial containment of system layered structure or its component objects within the geometric region of their container object
Their tools fail to provide an integrated geometric specification of the system logical construct. Their tools are not able to enact and adapt the system design to meet changing operational requirements.
The current generation of open programming environments and object oriented object design tools fails to create adaptive systems engineering tools. They fail to resolve invisibility, unvisualizability, complexity, changeability, resource constraints, dynamic scheduling, and spatial semantic problems of software intensive systems. Without a capability to create and capture unambiguous integrated geometric specifications of software intensive systems, current state of the art tools are not enabled with design automation methods. These methods would be used to synthesize, assess and enact planned software intensive products before significant development, integration and test cost are incurred.
Alam, M. A., 1977, “Adaptive Spectral Estimation”, Joint Automatic Control Conference, Vol. 1, pp. 105-122
Athans, M., April 1987, “Command and Control Theory: A Challenge to Control Science”, IEEE Transactions on Automatic Control, Vol. 32, No 4
Bailin, S. C., 1989, “An Object-Oriented Requirements Specification Method”, CACM 32, 5
Box, G. E. and G. M. Jenkins, 1976, “Time Series Analysis, Forecasting and Control”, Holden Day
Brooks, F. P., 1987, “Essence and Accidents of Software Engineering”, Computer
Champeaux, D., Faure, P., 1992, “A comparative study of Object-Oriented Analysis Methods”, JOOP
Clarke, D. W., 1969, “Generalized Least Square Estimation of the Parameters of a Dynamic Model”, National Physics Laboratory, Report AUTO 26
Coad, P. and E. Yourdon, 1990, “Object-Oriented Analysis”, Yourdon Press, Prentice Hall, Englewood Cliffs, N.J.
Desmond, J. P., 1999, “Modeling for The Masses”, Component Strategies
Godfrey, K. R., 1969, “Dynamic Analysis of an Oil Refinery Unit under Normal Operating Conditions”, Proc. IEEE, 116, pp. 879-892
Jacobson, I., 1987, “Object-Oriented Development in an Industrial Environment”, OOP-SLA '87 Conference proceedings, Orlando, Fla.
Makhoul, J., April 1975, “Linear Prediction, A Tutorial Review”, Proc. IEEE, vol. 63, no. 4, pp. 561-580
Makhoul, J., October 1977, “Stable and Efficient Lattice Methods for Linear Prediction”, IEEE Transactions on Accoustics, Speech and Signal Processing, vol. ASSP-26, pp. 423-428
Makhoul, J., August 1978, “A Class of All Zero Lattice Digital Filters: Properties and Applications”, IEEE Transactions on Accoustics, Speech and Signal Processing, vol. ASSP-26, no. 4, pp. 304-314
Messershmitt, D. G., April 1980, “A Class of Generalized Lattice Filters”, IEEE Transactions on Accoustics, Speech and Signal Processing, vol. ASSP-28, no. 2, pp. 198-204
O'Dell, J. and J. Martin, “Object-Oriented Analysis and Design”, Prentice Hall, Englewood Cliffs, N.J.
Riley, D. and J. P. Burg, 1972, “Time and Space Deconvolution Filters”, SEG Convention, Anaheim, Calif.
Rumbaugh, J. et al, 1991, “Object-Oriented Modeling and Design”, Prentice Hall, Englewood Cliffs, N.J.
Shaler, S. and S. J. Mellor, 1988 “Object-Oriented Systems Analysis”, Yourdon Press, Englewood Cliffs, N.J.
Varaiya, P., February 1993, “Smart Cars on Smart Roads: Problems of Control”, IEEE Transactions on Automatic Control, Vol. 38, No 2
This invention provides new, physics-like computational models, called M computational models, which are used to capture and integrate the static and dynamic architecture of a real system. An M model is specified using a formal geometric language called the M Language. Design automation of an M model is carried out using a set of tools called Adaptive Model Reference (AMR) tools. These tools automate the integration of system components into operational systems that can be adapted during run time to meet end users' functional and system performance requirements. Several objects and advantages of the present invention are:
To provide a formal geometric language called the “M Language” supported by automated tools. This language provides syntactically valid visual sentences, and provides semantic and mathematical interpretation of these sentences. The M language provides generalized icons for annotating system objects, and associates a geometric region with each object. These regions are geometrically arranged to specify geometric plan and elevation projections of the static and dynamic structure of a real system. The M language is diagram-based, and is generalized icon-based where the icon of each region provides the dual representation of a physical part (the pictorial image) and a logical part (the meaning).
To provide expert rules and tools used to construct M models. These models are geometric, bipartite, directed, token based models specified using the M language. M models capture in a single geometric graph type the information now typically specified by a set of graph types such as tree graphs, inheritance graphs, state transition graphs, data flow graphs, control flow graphs, and Petri Net graphs.
To provide expert rules and tools used to construct a static architecture of a real system called the “M static architecture”. This architecture provides an integrated geometric specification of object classification, association, and composition relationships between the component objects of a real system.
To provide expert rules and tools used to construct a dynamic architecture of a real system called the “M dynamic architecture”. This architecture provides a geometric specification of the constrained behavior of a real system. An M dynamic architecture is specified using a new type of networks called “Adaptive Loop Information Nets” (ALI_Nets). Each ALI_Net specifies behavior and functional performance goals of a semantic system partition which is observable, controllable, and configurable.
To provide expert rules and tools used to construct an integrated architecture of a real system, called an “M Integrated Architecture”. This architecture integrates into a single geometric graph the operational requirements architecture, which specifies performance constrained interactions between external system objects, and the design control architecture which specifies performance constrained interactions between internal system objects.
To provide expert rules and tools used to bind component objects of a real system into an integrated architecture that can be controlled and adapted to evolving users requirements. The term control is used to mean all aspects of decision making that are applied to adapt a system during its development to compensate for requirement changes and design errors, and during run time operation to compensate for unanticipated operational system conditions.
To provide expert rules and tools used to construct an adaptive multi-level design control scheme which monitors, controls and adapts the behavior of the multi-layer integrated architecture of a real system. This scheme is composed of a set of concurrent control processes which are supervised by a set of adaptive supervisory control processes. Lower levels of the adaptive scheme regulate physical resources of a real system. Higher levels control and adapt distributed information processing functions.
To provide expert rules and tools used to specify a group of one or more design control architectures for each operational requirements architecture and specify a group of one or more implementation architectures for each design control architecture.
To provide expert rules and tools used to evaluate static structure metrics and dynamic structure metrics of the integrated architecture of a real system. Static structure metrics include fractal dimension, entropy coupling, and deadlock metrics. Dynamic structure metrics include load, service time, response time, and utilization level metrics.
To provide expert rules and tools used to evaluate cost, value, and performance sensitivity of current and proposed business operations of a real system.
FIG. 0: Coloring Scheme Legend
FIG. 1: Adaptive Model Reference Procedures
FIG. 2: M Cellular Display
FIG. 3: Geometric Encapsulation of Object Resources
FIG. 4: Geometric Composition of an Object Region
FIG. 5: Geometric Composition of a Resource Region
FIG. 6: Folded and Unfolded Object Regions with an Internal Shared Resource Region
FIG. 7: Folded and Unfolded Object Regions with an Internal Private Resource Region
FIG. 8: Folded and Unfolded Resource Region
FIG. 9: Folded and Unfolded Public Interface Region of an Object
FIG. 10: Isomorphic Projections of an Unfolded Region
FIG. 11: Folding and Unfolding Rules of the Real Numbers Set
FIG. 12: Geometric Composition of an M Atomic Connection
FIG. 13: Geometric Projections of a Multi-layer Stack of Objects
FIG. 14: Encapsulation of a Resource Region
FIG. 15: Geometric Projection Rules of Multiple Stacks of Layered Objects
FIG. 16: Features Table of Various Object Oriented Design Methods
FIG. 17: Static Models used by Object Oriented Design Methods
FIG. 18: Dynamic Models used by Object Oriented Analysis Methods
FIG. 19: The Not-integrated Set of Dynamic and Static Models used by Object Oriented Design Methods
FIG. 20: Geometric Representation Rules of Hierarchical Data Structures
FIG. 21: Geometric Representation Rules of Hierarchical Function Structures
FIG. 22: Geometric Representation Rules of State Transition Graphs
FIG. 23: Geometric Representation Rules of Data Flow Graphs
FIG. 24: Geometric Representation of Mode B Data Flow Graphs
FIG. 25: Geometric Representation of Petri Net Token Based Graphs
FIG. 26: Folded Geometric Representation of an M Model
FIG. 27: Geometric Representation of Logic Primitives
FIG. 28: A Program Fragment Represented Using Geometric Primitives
FIG. 29: Plan Projection of AMR Construction Procedures and Tools
FIG. 30: Plan Projection of AMR Procedures and Tools
FIG. 31: Plan Projection of AMR Knowledge Controller
FIG. 32: Elevation Projection of AMR Tool-Supported Procedures
FIG. 33: Plan Projection of a Real System
FIG. 34: Elevation Projection of a Real System
FIG. 35: Elevation Projection of an M Iterative Map of a Real System
FIG. 36: Plan Projection of an M Iterative Map of a Real System
FIG. 37: Time-Space Evolution Grid
FIG. 38: Operational Model of AMR Architecture Specification & Analysis Tools
FIG. 39: AMR Architecture Specification Procedure
FIG. 40: Lower Level Composition of AMR Architecture Specification Procedures
FIG. 41: Geometric Representation of Object Association Models
FIG. 42: Geometric Interface of Object Association Models
FIG. 43: Types of Object Constraints
FIG. 44: Geometric Representation of an Object Classification Model
FIG. 45: Geometric Representation of a Multiple Inheritance Model
FIG. 46: Fractal Representation of a “Part_Of” Relationship
FIG. 47: Fractal Representation of a “Has_A” Object Relationship
FIG. 48: Fractal Representation of a “Knows_A” Object Relationship
FIG. 49: Fractal Representation of a Multiple Object Attribution Relationship
FIG. 50: Plan Projection of an Integrated Static Object Model
FIG. 51: Fractal Composition of a System
FIG. 52: Fractal Composition of Object Attributes
FIG. 53: Attribute Sets of an Object
FIG. 54: Orthogonal Projection of an Object
FIG. 55: Object/Loop State Graphs
FIG. 56: Geometric Representation of a Fuzzy Object
FIG. 57: Multi-value Logic Representation
FIG. 58: Orthogonal Projection of Aggregated Objects
FIG. 59: Dynamic Architecture Model
FIG. 60: ALI_Net Loop Composition
FIG. 61: Plan Projection of an ALI_Net Composition Model
FIG. 62: Plan Projection of an Aggregated Set of ALI_Nets
FIG. 63: Open/Closed Designation of a Set of Object Loops
FIG. 64: Cascade Aggregation Structures of a Set of Object Loops
FIG. 65: Elevation Projection of Cascade Aggregation Structures of a Set of Object Loops
FIG. 66: Parallel Aggregation Structures of a Set of Object_Loops
FIG. 67: Elevation Projection of Parallel Aggregation Structures of a Set of Object_Loops
FIG. 68: Multi-layer ALI_Net Composition of an Integrated Architecture
FIG. 69: Elevation Projection of a Layered Object Loop
FIG. 70: Fractal Representation of a Corba and a COM Object
FIG. 71: Fractal Representation of an Interface Message Set
FIG. 72: An Example of Two Connected Loops
FIG. 73: An M Compound Connection
FIG. 74: Basic Two Sided Communication Construct
FIG. 75: Loop_Fork_Communication Construct
FIG. 76: Loop_Branch_Communication Construct
FIG. 77: Loop_Join_Communication Construct
FIG. 78: Elevation Projection of the Connected Two Loop Example
FIG. 79: High Level Plan Projection of the Connected Two Loop System Example
FIG. 80: Lower Level Plan Projection of the Connected Two Loop System Example
FIG. 81: “Message/Data/objects” Wiring Diagram, The Two Loop System Example
FIG. 82: Multi Level Wiring Diagrams of Container and Contained Objects
FIG. 83: Layered Composition of an ALI_Net Dynamic Graph
FIG. 84: An ALI_Net Business Tracking Graph
FIG. 85: An Aggregated ALI_Net Business Tracking Graph
FIG. 86: Categories of Cognitive Models
FIG. 87: Fuzzy Linguistic Models
FIG. 88: The Two Design Space Models
FIG. 89: Elevation Projection of the Object Loops of an Integrated Architecture
FIG. 90: Geometric Representation of an Information Access Loop
FIG. 91: ALI_Net Components of an Integrated Architecture
FIG. 92: Layered structure of Nettronic, Infotronic and Mechatronic Container Objects
FIG. 93: Elevation Projection of Nettronic, Infotronic and Mechatronic Object Stacks
FIG. 94: Plan Projection of Nettronic, Infotronic and Mechatronic Object Stacks
FIG. 95: Cellular Projections of a Set of Infotronic and Mechatronic Objects
FIG. 96: Plan Projection of an Infotronic Object
FIG. 97: Elevation Projection of a Two Node Architecture
FIG. 98: Geometric Projection of a Cellular System Architecture
FIG. 99: Multi-Dimensional Folding of an Object Region
FIG. 100: Mapping of Virtual State Space Grid to Physical Space Grid
FIG. 101: Euclidean Physical Space Grid
FIG. 102: Operational Model of AMR Planning, Scheduling and Control Tools
FIG. 103: AMR Planning Procedure
FIG. 104: Geographical Configuration of System Objects
FIG. 105: Specification of Geographical Constraints
FIG. 106: Mechatronic Object Navigation Mechanisms
FIG. 107: Cellular Allocation of Mechatronic and Infotronic Objects
FIG. 108: Communication Connections
FIG. 109: Human & Physical Objects Scheduling Procedure
FIG. 110: Operational Model of the AMR Automated System Control Scheme
FIG. 111: Plan Projection of the AMR Control Scheme of an Automated System
FIG. 112: Two Layers Elevation Projection of the AMR Control Scheme of an Automated System
FIG. 113: Three Layers Elevation Projection of the AMR Control Scheme of an Automated System
FIG. 114: Dynamic Relationship Constraints Interface
FIG. 115: AMR_Loop_Process Data Structures
FIG. 116: AMR Message Header Format
FIG. 117: ALI_Net Message Header Format
FIG. 118: Plan Projection of an AMR Concurrent Application Control Process
FIG. 119: Subloops of a Concurrent Application Control Process
FIG. 120: High Level Control Loops Binding Supervisory and Concurrent Application Control Processes
FIG. 121: High Level Elevation Projection of an AMR Supervisory Control Process
FIG. 122: Compound Connections of Concurrent Application Control Processes
FIG. 123: High Level Plan Projection of a Concurrent AMR Supervisory Control Process
FIG. 124: Subloops of a Concurrent AMR Supervisory Control Process
FIG. 125: AMR Overload Monitor
FIG. 126: Loop Cycle Window Measurements
FIG. 127: Internal structure of AMR Learning Controller
FIG. 128: Elevation Projection of Model Estimation and State Prediction Procedure (The Impulse Response Ladder)
FIG. 129: Elevation Projection of Model Estimation and State Prediction Procedure (The General Auto Regressive Ladder)
FIG. 130: Elevation Projection of Model Estimation and State Prediction Procedure (The PreWhitening Ladder)
FIG. 131: Elevation Projection of Model Estimation and State Prediction Procedure (The Optimum Dead Time Impulse Response Ladder)
FIG. 132: Elevation Projection of Model Estimation and State Prediction Procedure (The Time Shifted, Compact Form Ladder)
FIG. 133: AMR Performance Controller
FIG. 134: Lower Level Composition of the AMR Performance Controller
FIG. 135: Lower Level Composition of the AMR Fuzzy Control Engine
FIG. 136: Fuzzy Performance Control Membership Functions
FIG. 137: Control Rules of Loop_Response_Time (LRT) Measurements of Critical Loops
FIG. 138: Control Rules of Predicted Loop_Response_Time (LRT) Measurements of Critical Loops
FIG. 139: Control Rules of Loop_Load (LL) Measurements of Critical Loops
FIG. 140: Control Rules of Predicted Loop_Load (LL) Measurements of Critical Loops
FIG. 141: Control Rules of Loop_Service_Time (LST) Measurements of Critical Loops
FIG. 142: Control Rules of Predicted Loop_Service_Time (LST) Measurements of Critical Loops
FIG. 143: Control Rules of Loop_Resource_Utilization_Level (LRUL) Measurements of Critical Loops
FIG. 144: Control Rules of Predicted Loop_Resource_Utilization_Level (LRUL) Measurements of Critical Loops
FIG. 145: Business Management ALI_Nets
FIG. 146: Lower Level Composition of Business Management ALI_Nets
FIG. 147: Value Cost Trade-off Analysis
FIG. 148: AMR Value Cost Analysis
FIG. 149: AMR Parallel Simulation Engine
FIG. 150: Three Basic Categories of Work Break-Down Structures
FIG. 151: Work Break-Down Structure Relationships
FIG. 152: A Set of ALI_Net Dynamic Graphs
FIG. 153: A Set of Business Control Graphs
FIG. 154: Overview of the Pull Down Menus of AMR Tools
FIG. 155: Architecture Categories Rules
FIG. 156: Category Specification Rules
FIG. 157: Project Region
FIG. 158: Project Instances Data Base
FIG. 159: Project ALI_Net Specification
FIG. 160: ALI_Net Type Specification
FIG. 161: Object Region
FIG. 162: Object Type Specification
FIG. 163: Object Instances Data Base
FIG. 164: Storage Region
FIG. 165: Storage Type Specification
FIG. 166: Storage Instances Data Base
FIG. 167: Pipe Region
FIG. 168: Pipe Type Specification
FIG. 169: Pipe Instances Data Base
FIG. 170: Loop Region
FIG. 171: Loop Type Specification
FIG. 172: Loop Instances Data Base
FIG. 173: Model Manipulation
FIG. 174: Containment Relationship Constraints
FIG. 175: Association Relationship Graph
FIG. 176: Association Constraints Specification
FIG. 177: Loop Relationship Constraints
FIG. 178: Architecture View Types
FIG. 179: Region View Types
FIG. 180: Structural Analysis Reports
FIG. 181: Dynamic Analysis Reports
FIG. 182: Real System Planning
FIG. 183: Specify Geographical Constraint of Infotronic & Organizational Objects
FIG. 184: Plan Projection of a Node Configuration Example
FIG. 185: Specify Geographical Constraint of Mechatronic Objects
FIG. 186: Plan Routing & Connectivity of Mechatronic Objects
FIG. 187: AMR Supervisory Control
FIG. 188: AMR Monitoring_Views Controller
FIG. 189: AMR Learning Controller
FIG. 190: AMR Performance Controller
FIG. 191: AMR Configuration Controller
FIG. 192: AMR Security Controller
FIG. 193: AMR Reliability Controller
FIG. 194: Equipment Scheduling
FIG. 195: Personnel Scheduling
FIG. 196: ALI_Net Scheduling
FIG. 197: Real System Identification
FIG. 198: AMR Project Management
FIG. 199: Plan Projection of the AMR Tools Kit
FIG. 200: Plan Projection of an AMR Knowledge Controller
FIG. 201: Plan Projection of the Tool Kit M Schemas
FIG. 202: Plan Projection of Inter-connections Between M Schemas
FIG. 203: Isomorphic Plan Projection of Inter-connections Between M Schemas
FIG. 204: Elevation Projection of a Multi_Level Architecture
FIG. 205: Elevation Projection of a Set of Multi_Level Schemas
FIG. 206: Components of a Multi_Level Schema
FIG. 207: Unfolded Projection of a Set of AMR Knowledge Controllers
FIG. 208: Plan Projection of a Homogeneous Set of AMR Tools
FIG. 209: Plan Projection of the Partially Distributed Knowledge Controller Tools Kit
FIG. 210: Elevation Projection of the Operational Model of an AMR CDE Knowledge Controller
FIG. 211: Operational Model of an AMR COE Configuration and Installation
FIG. 212: Multi_Level Integration of UML Models
FIG. 213: Heterogeneous Tools Schema Relationships
In this invention a tools-supported formal geometric visual language called the M Language is specified where:
Formal language means that the language not only specifies syntactically valid visual sentences, but also provides semantic and mathematical interpretation of these sentences. This interpretation is used to analyze, verify, validate, control, and adapt the run time behavior of the developed system.
Geometric language means that the language not only provides generalized icons for annotating system objects, but also associates a geometric region with each object. These regions are geometrically arranged to specify the spatial elevation and plan projections of 1) static system structure constraints such as containment, association and connection relationships of the system components, 2) dynamic system structure constraints such as performance, reliability, and security constraints of the interconnected system components, and 3) the implications of static and dynamic system constraints on the system data flow, control flow, and state transition relationships.
Visual language means that the language is not only diagram-based, but is also generalized icon-based. By generalized icon, we mean that the icon of each region provides the dual representation of a physical part (the pictorial image) and a logical part (the meaning).
The M language is used to specify a new class of systems engineering tools called Adaptive Model-Reference (AMR) tools. These tools are specified using the following four sets of procedures as shown in FIG. 1:
AMR Architecture Specification and Analysis Procedures. These procedures provide rules used by system architects and designers to construct, adapt, and verify the blue prints of the integrated system design using the geometric language of this invention as shown in procedures 1-5, and 9-10.
AMR Development and Manufacturing Procedures. These procedures are used by developers of information objects and fabricators of physical objects to create objects specified in the blue prints of the system architecture design.
AMR Planning, Scheduling, and Enactment Procedures. These procedures provide rules used by business managers and system operators to plan business operations, schedule resources, enact, control and sustain the run time behavior of systems specified using the geometric language of this invention as shown in procedures 5, 7, 8, 9, and 10.
AMR Business Management Procedures. These procedures provide rules used by project managers to construct, adapt, and verify the blue prints of the business missions performed by real system operations as shown in procedure 6.
Procedure 1: Tessellation Rules of an M Cellular Display
Geometric models of this invention are constructed using a cellular display called the M cellular display. This display is virtual, tessellated, and wraparound. It is virtual and tessellated using equilateral triangle tiles such that there are no gaps and no tiles overlap as shown in FIG. 2. The wraparound requirement implies that the display is tiled such that when a point is guided off the left side of the display, it appears at the same height on the right side. Similarly when a point moves off the top of the display area, it reappears at the corresponding position on the bottom. The virtual cellular requirements imply that the display is partitioned into cells where each cell is composed of two adjacent triangular display tiles as shown in FIG. 2, and each cell represents a unique segment in the system spatial state grid. A set of one or more triangular display tiles are used, in the following procedures, to construct primitives of the formal geometric visual language of this invention.
Procedure 2: Geometric Production Rules of Object Regions
Geometric representation of systems is carried out using the following five steps procedure:
First, the symbol Δ is used to define the geometric region of an abstract or a real system, its named mechatronic or infotronic component objects, or the named transformation functions performed by the component objects. A real system is defined as a set of one or more physical processes, such as sensors, energy transformation, material and information transfer equipment; data processors and their associated software; and human operators and system users. The system region Δ, specifies the boundaries of a geometric area which contains the set of geometric regions of all of it's component objects. It follows that the system geometric root region Δ is a container of a set of object regions Δ where system component objects reside. An object, whose region consists of a single tile, is called a visually atomic object if it's internal structure is not visually specified. An object which is not visually atomic is called a visually compound object.
Second, as shown in FIG. (3-c), an object region Δ, of each visually specified object, is composed using four special types of geometric regions called atomic regions. These regions are called an operation region; an attribute or a resource region; a referential attribute region; and a public interface region where, as shown in FIG. 3:
An operation region Δ is an active geometric region used to specify the set of object operations called methods or member functions required to access object variables. The set of operations performed by an object defines the operational interface or message protocol of the object.
An attribute or a resource region ∇ is a passive geometric region used to specify the set of attribute types (or variables), attribute values of a place, such as computer memory, where these attributes reside, or physical resources, such as an operational facility or a hardware processor, required to house and execute object functions.
A referential attribute region ∇ is a passive geometric region used to specify the set of referential attributes which specify linking, embedding, and containment relationships with other objects.
A public interface region ∇ is a passive geometric region used to export the named object message protocol. In other words define the list of the named object operations, their signature and type of attributes provided by the container object and its contained objects.
A loop connections duct, a tube used to house, represent, the set of loop connections supported by an object.
Third, each object region is composed of a set of one or more method regions as shown in FIG. 4. In this figure each composition pattern resides within the minimum containing rectangle allocated to the root object region, called the initiator object region. Furthermore, if all methods share the same set of object attributes then all method regions are adjacent to a single object resource region as shown in FIG. 4. Similarly, each resource region can be decomposed into a set of one or more resource regions as shown in FIG. 5. In this figure each composition pattern resides within the minimum containing rectangle allocated to the root resource region, sometimes called the initiator resource region. To create planar displays of connections between various method regions, method regions may be folded or unfolded. By applying the tessellated wraparound requirements of the virtual display area, as specified in procedure 2, isomorphic geometric representations of folded/unfolded method regions are constructed as specified in FIGS. 6 and 7. Similarly FIG. 8 illustrates the folding/unfolding rules of the resource regions of an object and FIG. 9 illustrates the folding/unfolding rules of the resource regions of the public interface of an object. The unfolded patterns of FIGS. 6 to 9 can be equally represented by the unfolded pattern shown in FIG. 10. Application of these rules to the folding and unfolding of the real numbers set is shown in FIG. 11.
Fourth, various geometric regions are connected to form an atomic connection which is bipartite, directed, and token based as shown in FIG. 12. These connections are constructed using the Edge symbol →. The bipartite requirement disallows the connection between two regions of the same type i.e. only a Δ region can only be connected to a ∇ region and vice versa. Two basic types of atomic connections are defined. The first type of connection, called staged connection as shown in FIG. (12-a), is normally used to specify the flow of material or energy resources consumed or generated by system physical objects where the outputs of the producer object are deposited into a shared storage resource region where they are subsequently used by the consumer object. The second type of connection, called pipe connection as shown in FIG. (12-b), is used to specify the communication between a set of collaborating objects. Pipe connections are established using public interfaces of producer objects. These connections are used to represent push and pull communication models as shown in procedure 5.2.1. As shown in FIG. (12-c), an equivalent Petri Net can be created for FIGS. (12-a) and (12-b). FIG. (12-c) lacks an explicit representation of different communication semantics captured in FIGS. (12-a), (12-b), and (73). See procedure 5.2.1 for further details.
Fifth, two types of geometric projections, called plan projection and elevation projection, are constructed for a multilayered stack of objects as follows:
The elevation projection is constructed by assigning, for each layered object, FIG. (13-a), an object region Δ and an interface region ∇ as shown in FIG. (13-b).
Each object region is recursively contained within the geometric region of the higher level container object as shown in FIG. (13-c). For a set of n layered objects, this process is repeated n times.
The resource region of each object, including abstract data types, may be encapsulated as shown in FIG. 14. This process can be recursively applied until each resource region represents passive data structures, i.e. not abstract data structures which are not encapsulated by an object.
The above procedure can be applied to construct container objects containing a set of co-centric regions where the order of region containment is the same as the order of layering of system objects. This implies that the most inner object region represents the lowest layered object. Plan projections generated by this procedure provide an intrinsic means for preserving the integrity of the designed system layered structure where objects cannot be connected to objects belonging to non-adjacent layers. As shown in FIG. 15, geometric projections of multiple stacks of layered objects can be constructed by the above procedure. FIGS. 13 and 14 provide visual representation of containment relationship constraints between layered objects. Other types of constraints such as association and value constraints are further incorporated in the system visual specification as shown in FIGS. 43 and 114
Procedure 3: Geometric Production Rules of an M Model
System specifications are usually developed using traditional functional decomposition and structured design methods or state of the art object oriented methods listed in FIG. 16. These methods provide procedures for the specification of a system's underlying static and dynamic models as shown in FIGS. 17, 18 and 19. At least four types of graphs are used by structured design and object oriented methods. The first type, called a tree graph, is used to specify the hierarchical function and data structures of the designed system. The second type, called a state transition graph, is used to specify various system states (operating modes) and state transitions triggered by internal and external events handled by the system. For each of the system modes, the third type, called a data and a control flow graph, is used to specify the input/output data and control flow relationships between the system transformation functions. The fourth type, a Petri Net graph, has a syntax which enables system designers to capture, in the same graph, both state and data flow system specifications. In this invention information provided by the above four types of graphs are captured into a single geometric graph, called an M model, using the following seven step procedure:
First, a resource region ∇ is allocated to each child vertex, at each level, of the hierarchical data structure tree graph. As shown in FIG. (20-a) example, an optional generalized icon may be associated with the geometric region. Child regions, at each level, are aggregated into a parent compound data structure resource region. These rules generate the folded geometric representation of the hierarchical data structure graph as shown in FIG. (20-b).
Second, a function region Δ is allocated to each child vertex, at each level, of the hierarchical function structure tree graph. As shown in FIG. (21-a) example, an optional generalized icon may be associated with the geometric region. Child regions, at each level, are aggregated into a parent compound function region. These rules generate the folded geometric representation of the hierarchical function graph as shown in FIG. (21-b).
Third, a resource region ∇ is allocated to each event ei in the state transition graph and a function region Δ is allocated to each action. As shown in FIG. (22-a) an optional generalized icon may be associated with the different types of geometric regions. These rules generate the unfolded geometric representation of the state transition graph as shown in FIG. (22-b).
Fourth, a resource region ∇ is allocated to each data flow Di in the data flow graph and a function region Δ is allocated to each function Fi. This rule, in conjunction with procedure 2 rules, are applied to the data flow graph associated with each system mode. As shown in FIGS. (23-a) and (24-a) an optional generalized icon may be associated with the different types of geometric regions. These rules generate the unfolded geometric representation of the data flow graphs of each system mode as shown in FIG. (23-b) and (24-b).
Fifth, the data flow graphs of each system mode can be combined in a single token based Petri Net graph as shown in FIG. (25-a). This figure assimilates information provided in FIGS. (23-a) and (24-a). Similarly FIGS. (23-b) and (24-b) can be assimilated to generate FIG. (25-b). This figure provides an unfolded geometric representation of data flow information for both system modes.
Sixth, procedure 2 rules are used to generate a single integrated geometric graph as shown in FIG. 26. This graph integrates the folded geometric representation of all information provided in FIGS. (20-25). FIG. 26 provides visual integrated view of static and dynamic system structures.
Seventh, processing logic of each function, or object method can be specified using the set of logic primitives shown in FIG. 27. Each generalized icon of these primitives has the trio representation of a physical part (the pictorial image), a logical part (the meaning) and a process part (the computation). FIG. (28-b) illustrates how FIG. 27 primitives can be used to generate geometric representation of the program fragment shown in FIG. (28-a).
These projections illustrate how the “tools-supported” procedures of this invention can be used by project managers, system architects, designers, developers, fabricators and operators to manage, specify, analyze, and create adaptive computer based systems as shown in the following procedures.
Procedure 4: Geometric Production Rules of an M Iterative Map
This procedure provides the framework used for the geometric specification of the internal design structure of a real system and its dynamic interaction with its external environment as follows:
First, the plan and elevation projections of a real system and its outer environment are outlined as shown in FIGS. 33 and 34. In these projections:
An External System region Δ, named XS, is defined. This region contains all automated systems, physical processes, and organizations that are not included within the boundary of a real system under investigation. As shown in procedure 5.2.2, the XS region to construct the external design control model, called the operational requirements architecture model of a real system as described in procedure 5. This model specifies and controls the behavior of business operational activities performed by external human objects. These activities provide a framework for specifying the desired functional and behavioral specification of the operational requirements of a distributed real system RS under investigation. Objects contained within the external system region are called external system objects. The multi-layered plan and elevation projections of these objects can be generated using procedure 2 rules.
A Real System region Δ, named RS, is defined. This region contains all objects, within the stated system boundary, that function to satisfy the desired system behavior. This region is used to construct an internal system design control model, called the design control architecture model as described in procedure 5. This model is used to specify and control the behavior of activities performed by various real system objects. Objects contained within the internal system region are called internal system objects. The multi-layered plan and elevation projections of these objects can be generated using procedure 2
The resource regions, named XSS and SS, contain all the state variables, and resources, of the XS and S regions respectively.
All interactions between external and internal system communicating objects are specified using pipe connections of the type shown in FIG. 12-b. These connections are established using the pull and push public interfaces of both external and internal system objects.
Second, an integrated system evolution model is specified using an iterative system map called the M iterative map as shown in FIGS. 35 and 36. By an integrated model, we mean that the model can be applied to represent the evolution of both the container and contained system objects at all levels of system aggregation and abstraction. System evolution is defined as both spatial and time evolution of systems. Spatial evolution means that, at each point of time t, a system has a geometric design structure which records the evolutionary processes used to create the observed physical state and information state structure at time t. Time evolution means that evolution of the system state, its static and dynamic design structure during development, maintenance and run time operations. As shown in FIGS. 35 and 36:
Spatial evolution of the system at the event time k is captured by the kth element of the “Spatial Evolution Array” SEA (k)=[XS(tk), S(tk−1)] where:
In the above equation, the system operations F and G specify mapping of system inputs into outputs where ss(tk+1)=F(ss(tk−1), i(tk)) and o(tk+1)=G(ss(tk+1)). In this formula i(ti) and o(ti+1) specify the values of the system input and output variables at event times ti and ti+1 respectively.
Time evolution of the system at the event time k is captured by the sequence of all elements of the “Time Evolution Array” TEA (i) where i=0, k and TEA (i)=[XS(ti), xss(ti), o(ti+1), S(ti−1), ss(ti−1), i(ti)].
For most systems of practical importance, the set of system operations F and G, are specified using a mixture of discrete event and discrete time dynamical system models. For many application systems these operations are usually time variant, nonlinear and distributed which gives rise to complex system behavior. Adding to these complexities, these systems are often subject to a sequence of events that contains surprises and unpredictabilities such as variations in system loads and equipment aging. These events result in unexpected failures, not to mention hidden system design and software implementation errors. All these factors combined lead to failure to control the system design, it's development, and it's run time behavior. To help management of system complexities, the core subject of this invention is to provide system designers and users with analysis, display, design control, and run time tools that enable the design of systems that can be adapted to meet their desired system requirements (see procedures 5, 6 and 7).
Third, to untangle spatial and time system complexities, the space-time grid shown in FIG. 37 is used to specify the design control architecture of a real system as shown in FIGS. 38, 39 and 40 where:
The spatial and time evolution of the system design structure is specified using a sequence of time indexed instances of the system model where each element in this sequence is a snapshot of the system state space structure at a specified time instant.
The spatial “state space” projection of each element in the sequence is specified using the following three types of models as shown in FIGS. 39 and 40:
A minimum static architecture model. This is an M model which provides an integrated geometric representation of classification, association and aggregation relationships between system objects. A minimum static architecture model is created using procedure 5.1.
An integrated architecture model. This is an M model which is used to partition a system dynamic architecture into a minimal set of independent, observable, controllable subsystems called Adaptive Loop Information Nets (ALI_Nets). An integrated architecture model is created using procedure 5.2.
An AMR design control scheme. This scheme is used to adapt behavior of a real system ALI_Nets to meet desired behavior as specified in the operational requirements architecture model. The real system AMR design control scheme is created using procedure 5.3.
Fourth, the sequence of time indexed M models, shown in FIGS. (35-37), are used to specify the time evolution of the system during all phases of the system life cycle. Two types of time dependent changes are captured by the system time projection: system structure changes and changes in the values of system state variables specified by the system design structures. The time projection of the latter type of changes is specified using the ALI_Net state graphs described in procedure 5.1.2. Information captured by these diagrams is used in procedure 5.3.3.2 to control the system run time behavior.
Procedure 5: Control Oriented Production Rules of Adaptive Integrated Architectures
Control oriented design of adaptive integrated architectures is carried out using procedures 5.1 to 5.3.
Procedure 5.1: Geometric Specification of a Minimum Static Architecture
This procedure consists of two methods. The first method, described in procedure 5.1.1, is used to construct M models of the static semantic primitives of objects. These primitives are aggregated to specify an integrated static architecture model. The second method, described in procedure 5.1.2, uses the aforementioned model to specify the minimum static architecture model.
Procedure 5.1.1: Geometric Specification of a Static Architecture
System designers use object classification, association, and composition models to specify the system static type structure. Geometric representation of these models is carried out using the following five step procedure:
First, a Δ geometric region is allocated for each object type depicted on the object relationship model by a rectangle as shown in FIG. (41-a).
Second, a ∇ geometric region is allocated for each set of one or more directional object type relationships (role or associations). Each relationship is depicted on the object relationship diagram example by the symbol as shown in FIG. (41-b).
Third, for each association object, which contains references to the identifiers of each of the objects participating in the relationship, an association object region Δ is embedded within the ∇ relationship region as shown in FIG. (41-c).
Fourth, an optional generalized icon is associated with each geometric region. This icon is used to associate the geometric region with the original graph type semantics as shown in FIG. (41-c).
Fifth, three types of attribute sets are specified for each object namely: application function invocation attributes, object's attribute value constraints and object's association constraints. Each attribute set is encapsulated by a set of object methods. It follows that the public interface of each object can be partitioned into three sub-regions called the application function interface, the attribute value constraints interface, and the association relationship constraints interface. These regions are used to invoke object methods responsible for the specification and enforcement of system constraints, see FIG. (42 a-c). As shown in FIG. (43-a), three types of object attribute value constraints are defined: range constraints which are statements used to specify the lower and upper bound of the values of object variables, enumeration constraints which define the enumerated list of allowed values and their number, and relationship constraints which define the correct relationship between two or more object attributes. As shown in FIG. (43- b), three types of object association relationship constraints are defined: participation constraints which define the number of times an object instance of an object class can participate in a connected relationship, co-occurrence constraints which define the number of instances of different objects that can exist together in a relationship, and cardinality constraints which define the maximum number of instances of an object class.
The above procedure is used to develop the geometric representation for two special categories of object association models as follows:
The first category of models are object classification models based on the semantic primitives “Kind_Of” or “Is_A” object relationships. These relationships are used to specify class inheritance relationships. Geometric representation of these models is carried out using the following procedure:
First, for each branch of the inheritance tree graph, a Δ geometric region is assigned to each method of the derived class shown in FIG. (44-a).
Second, the region of each inherited method is embedded within a dashed ∇ geometric resource region. Subsequently this dashed resource region is embedded within the derived class regions as shown in FIG. (44-b). The use of a dashed line indicates that the method region is visually atomic and not partitioned into lower level methods.
Third, for each method a dashed ∇ inherited attributes region is embedded in the derived class resources region.
Fourth, the geometric representation of the multiple inheritance models, depicted in FIG. (44-a), is generated as shown in the example in FIG. 45.
The second category of models are hierarchical models based on the semantic primitives “Part_Of”, “Has_A”, and Knows_A” object relationships. These relationships are used to specify the aggregation and composition of objects using a set of component objects.
Given a “Part_Of” relationship, a geometric representation is developed as follows:
First, for each branch of the “Part_Of” relationship tree, a Δ geometric region, defined by a single triangular display tile, is allocated to each lowest level leaf of each tree branch shown in FIG. (46-a).
Second, the lower level object component regions are aggregated to form the geometric region of the higher level aggregated object as shown in FIG. (46-b). The compound object region is defined by the smallest equilateral containing triangle of its component regions.
As shown in FIG. (46-b), the above process may be reversed to decompose each compound object region into its component object regions.
Given a “Has_A” or a “Knows_A” attribution or association class relationship such as the relationships “O2 Has_A O4 and “O3 Knows_A O5”, a geometric representation is developed as follows:
First, for each component object, a geometric region is allocated. This region may consist of a single display tile for visually atomic objects and multiple display tiles for visually compound objects as specified in procedure 2.
Second, the component object regions are dragged to be totally embedded within the internal attributes region of the container object as shown in FIGS. (47 and 48). Since “Has_A” and “Knows_A” represent attribution types of class relationships between containers and component objects, their regions are geometrically contained within the attributes region of the container object. To demonstrate that component objects in “Knows_A” relationships have different life cycles from their containers, geometric projection of component objects are displayed with dashed lines as shown in FIG. 48.
Third, when multiple attribution relationships of different types are specified, their container plan projection is generated as shown in FIG. 49.
Object association, classification and composition geometric primitives, shown in FIGS. (41-49), are combined to enable the specification of an integrated static architecture of real system objects as shown in FIG. 50. The static architecture provides the necessary foundation for specifying the dynamic system design control scheme as shown in procedures 5.2 and 5.3.
Next, when system component objects are aggregated using “Part_Of” relationships, then the overall system is specified by a geometric fractal pattern as shown in FIG. 51. In this pattern, if the structure of the system at different levels of composition is self-similar, then when a portion of the geometric fractal is magnified it looks exactly like the higher level of system representation. Many systems cannot be represented by pure self-similar structures. Instead these systems can be represented by self-affine fractal structures. Self-affine structures are made of shrunken but distorted copies of the higher level structures. The fractal pattern representation of systems is a logical result of the bipartite containment constraints of each object region as specified in procedures 2 and 4. A similar pattern evolves when the same procedure is applied to specify the geometric structure of compound resource regions as shown in FIG. 52.
Finally various manipulations of the geometric displays specified in this invention are efficiently specified, stored and generated on computer display equipment using affine transformation with the following parameters R, S, Theta, Phi, E, F, Prob where:
R, S are scaling parameters along x and y coordinates
Theta, Phi are rotation parameters relative to x and y coordinates
E, F are translation parameters in the x and y directions
Prob is the probability of selecting an iterated function rule
Procedure 5.1.2: Geometric Specification of a Minimum Static Architecture
By a minimum static architecture model, we mean the composition of system objects using a minimal orthogonal set of Object Attributes Basis O(A_B) and a minimal orthogonal set of Object Function Basis O(F_B). The two sets are used to construct minimum object association, classification and composition geometric relationship models as follows:
First, three types of attribute sets are defined for each object namely: intrinsic attributes, referential attributes and object control attributes as shown in FIG. (53). Each set region can be further partitioned to specify sub-resource regions allocated to each attribute, some times called variables as shown in FIG. (54). If O(A) is the set of all object attributes, then O(A) can be partitioned into two subsets namely Primary_Attributes O(P_A) set and Derived_Attributes O(D_A) set such that:
If (a1, a2, a3, . . . , az) are elements of the Primary Attributes set O(P_A) and,
If (g1, g2, g3, . . . gk) are elements of the Derived_Attributes Generation rules set G(D_A), and,
If an+1=gj(a1, a2, a3, . . . , az), then
an+1∈O(D_A)
Consequently, the tuple [O(P_A), G(D_A)] defines for each object k, an orthogonal Attributes Basis O(A_B). This basis is a minimal attributes generator such that if an element is excluded from it, then the generated set of attributes will be a proper set of O(A). By applying the above rules, the minimum state of each object is defined by the set of values assumed by the orthogonal set of all object attributes O(P_A) at some instant of time t. These attributes specify the object state space vector O(S, t) where:
As shown in FIG. 54, a unique axis is associated with each object attribute (variable). This construction creates a planner representation of n dimensional space models. Since each of these variables resides in a resource region of the object model, it follows that associated with each axis there is a unique resource region.
Second, the object state O(S, t) at a given instant of time tk can be specified by a directed polygon graph, called an Object State or Loop State graph, as shown in FIG. 55. This graph depicts the values of the state variables of an object or a loop, at any given instance of time t, by connecting the temporal values of object state variables displayed on the attributes axis sets as shown in FIGS. (55-a, b). Each of these axes may be scaled to display the values of numerical and/or linguistic variables. Temporal evolution of object state is represented using the time indexed object state graphs shown in FIG. (55-b). Each of these graphs displays the lower and upper alarm limits and out of control limits for each system loop as shown in FIG. (55-c). The state of each ALI_Net at a given instant of time is specified by a directed polygon graph, called an ALI_Net state graph. This graph specifies the directed interconnection between two main sets of variables (resource regions) namely input/output state variables observed by external systems and internal state variables. Loop state graphs may be aggregated to display the aggregated behavior of a set of ALI_Net loops. Overlay of the current and desired state graphs specifying desired and current performance states provides an effective visualization of any deviations of object behavior. This deviation can be automatically detected to initiate necessary notifications and corrective action as shown in procedure 7.5.
Third, object attributes may be specified as crisp variables, such as input numerical information from sensor measurements and output numerical information to device actuators, or fuzzy variables such as input/output linguistic information meaningful to humans. When fuzzy logic is used, the two types of information are combined into a common frame work where a given object attribute value may belong to one or more sets of linguistic variables as shown in FIG. (56-a, b). The degree of membership in each of these sets is determined using member functions. The values of each of these functions are real numbers in the interval [0. 1]. By way of example FIG. (57-a) illustrates three member functions used to map numerical values of a crisp variable, say temperature measurements, onto three linguistic variable, say Cool designated by the blue color, Warm designated by the black color, and Hot designated by the red color. This mapping calculates for each numerical value, its degree of membership in various member functions as shown in FIG. (57-b).
Fourth, Object functions are classified based on their role and how they were generated. Generation-based classification partitions object functions into an Inherited Functions O(Ih_F) set and an Intrinsic Functions O(In_F) set. Role based classification partitions object functions into two sets:
Control_Functions O(C_F) set. Each element of this set can:
Invoke its functions based on attribute values set by other functions within the object or by object invocations.
Invoke other objects.
Edit shared system attributes.
Schedule the sharing of resources among system elements.
Application_Processing_Functions O(A_P_F) set. Each element of this set can:
Perform an iterative application processing function. These functions are usually domain specific.
Calculate object attribute values. These attributes may be used by a control module or by other application process modules.
Fifth, the set of all object functions O(F) is partitioned into two subsets namely Primary_Functions O(P_F) set and Derived_Functions O(D_F) set such that:
If (f1, f2, f3, . . . , fz) are elements of the Primary Function set O(P_F) and,
If (g1, g2, g3, . . . gk) are elements of the Derived_Functions Generation rules set G(D_F), and
If fn+1=(f1, f2, f3, . . . , fz), then
fn+1∈O(D_F)
Consequently, the tuple [O(P_F), G(D_F)] defines for each object k, an Object Function_Basis O(F_B). This basis is a minimal function generator where, if an element can be excluded from it, then the generated set of functions will be a proper set of O(F).
Sixth, a minimum set of static object relationship models is defined such that:
If (O1, O2, O3, . . . On) are the elements of the system Static Object Basis where Ok=[Ok(A_B), Ok(F_B)] and,
If (G1, G2, G3) are the elements of the three set of rules used to generate the set of classification and aggregated association and composition objects and,
If On+1=Gi(O1, O2, O3, . . . On), where I=1, 3, then
On+1∈O
where O is the set of all static object basis.
The above formulation implies that since component objects are aggregated to construct multi-level geometric fractal patterns of the type shown in FIG. 51, it follows that the orthogonal attributes basis of an aggregated object is the union of the attributes basis of all of its component objects as shown in FIG. 58. In this figure we illustrate, by way of example, the orthogonal representation of an aggregated three object system. In this figure, the aggregated object attributes set specifies shared application function attributes, referential attributes and control attributes.
Procedure 5.2: Geometric Specification of an Integrated Architecture
This procedure consists of two methods. The first method, described in procedure 5.2.1, enables the specification of a minimum dynamic architecture structure using ALI_Nets. These nets are used, in the second method described in procedure 5.2.2, to specify an integrated architecture model of a real system.
Procedure 5.2.1: Geometric Specification of a Minimum Dynamic Architecture
Software designers use a variety of diagrams, e.g. diagrams mandated by the Universal Modeling Language (UML), to capture the time ordered execution of object oriented systems. These models include:
Use Case diagrams to specify or characterize the behavior of a whole application system together with one or more external actors that interact with the system.
Message Trace or Sequence diagrams to illustrate the interactions among a set of objects in temporal order, which is used to understand timing issues.
Object Message or Collaboration diagrams to illustrate the objects and links that exist just before an operation begins and also the objects and links created (and possibly destroyed) during the operation.
State diagrams to describe the temporal evolution of an object of a given class in response to interactions with other objects inside or outside the system.
Currently information captured by these models is used to gain insight into the emerging dynamic behavior of the designed software system. This understanding has to be further integrated, in the system designer's mind, with other information derived from static architecture models such as class inheritance graphs, object association and object containment graphs. Each of these models provides a single representation of a particular aspect of the system structure, called single view, such as the classification structure view and the state transition view. To convey the semantic meaning of the evolving system design, each of these views is augmented with additional information expressed using natural language text. This approach of modeling software intensive systems gives rise to four major, related difficulties:
Requirements representation difficulties: Requirements not explicitly captured by existing design and analysis methods include: real-time constraints, performance constraints; contextual constraints like the necessity to coexist with existing systems; resource constraints of target system; reliability constraints; integrity constraints; security constraints; and safety constraints. Without an integrated architecture model which captures and integrates how the system design will not violate these constraints, it is impossible to design adaptive systems which can meet their desired operational requirements.
Comprehension difficulties: It is not easy for system and software specifiers, designers, and implementers to integrate information provided by the many visually disconnected design views, each of which uses different syntax and different symbols to convey the semantic meaning of the evolving system design. Without an integrated architecture model which captures the aggregated semantics of the evolving system, it is very hard to verify that the meaning of the evolving system conceptual and implementation design structure can satisfy end users' requirements.
System analysis difficulties: Without an integrated architecture model that enables formal mathematical analysis of the evolving system “state space and temporal” design complexities, it is impossible to make any assertions about system correctness, lack of deadlocks, boundness, safety, etc.
Control of changes difficulties: Without an integrated architecture model that can be used to plan, predict, implement and control changes to the system, it is not only very hard to understand the side effects and the behavioral implications of making changes to the system but also it is practically impossible to adapt system structure or its parameters, during it's run time operation, to meet desired system behavior requirements.
To resolve the above difficulties, a new class of design control models called Adaptive Loop Information (ALI) Nets are defined in this invention. These nets are the fundamental structuring mechanism used to:
Integrate information provided by various dynamic and static object models, called views, into an integrated system graph that may be hierarchically organized. Each of the traditional system design views, used by structured design or object oriented tools, is specified as a separate geometric, blueprint, overlay. The geometric aggregation of these overlays defines the integrated system graph in a manner similar to that shown in FIG. 26. This process is carried out such that the geometry of system objects and their relationships, for each of the system views, maintains an invariant relationship to their spatial relationship on their parent integrated graph.
Create a dynamic architecture model which consists of an external system design control model and an internal system design control model as shown in FIG. 59. The latter model is composed of a set of proper subsystems called ALI_Nets. Each ALI_Net can be independently configured, tested, modified, maintained and controlled to meet changing system requirements where:
Each ALI_Net must satisfy the following conditions:
Goal seeking Condition: Each ALI_Net has explicit user (outer directed) goals clearly delineated in the system operational architecture model, and implied design (inner directed) goals. The two sets of goals should be clearly linked in the integrated architecture model. Furthermore, the architecture of each ALI_Net should contain the three essential elements of control, application processing functions, and information feedback.
Motion Condition: Each ALI_Net is dynamic where, through execution (motion), component objects of the ALI_Net become interrelated and can interact.
Control Condition: System dynamics are controlled using a set of one or more, interacting ALI_Nets loops. Each ALI_Net is specified using three types of object loops: Application Processing loops, Control loops, and Diagnostic loops as shown in FIGS. 60, 61 and 62. Application processing loops are triggered by event types generated by external systems including system users. Processing of these events will result in generating desired application system outputs. Each application processing loop specifies the sequence of information flows and state transitions required to generate application system products under normal operating conditions. Diagnostic loops recognize fault events, analyze these events to identify causes of malfunctions and necessary corrective action. Control loops monitor operational performance of application processing loops and diagnostic loop results to adapt system structure, its configuration and the scheduling of its resources to achieve desired operational objectives of the real system. Two basic categories of subsystem control loops are defined. The first category is called physical object control loops. These loops are the traditional automatic control loops used in the process control, sensors, and manufacturing industries to regulate the behavior of the subsystem physical objects (physical devices). The second category is called information object control loops. These loops are used to monitor and adapt the dynamic behavior of the subsystem information processing objects to changes caused by the system operational environment. Specification, design, and run time enactment of information subsystem loops is a principal objective of this invention.
Cycle Time Condition: Each object loop component of an ALI_Net is viable during an identifiable period of time, called the loop cycle time, as shown in FIG. 35. Viable implies that during the loop cycle time, loop operations can be performed without the need for exchanging information with the system outer environment.
Stability Condition: Each ALI_Net has a structure for patterned behavior such that it demonstrates stability and continuity. Stability means that the system attains steady state in its environmental field and internally. But, a steady state does not mean static.
Aggregate information usually documented with use case, message trace and object message diagrams into system structures called Application Processing loops. These loops are specified in a manner that can be used to satisfy the proper subsystem conditions and, as such, enable the design of the necessary diagnostics and control loops required to adapt system behavior.
Define the essential information required to control the run time behavior of each proper subsystem. In a control-oriented model of systems, specification of the desired behavioral requirements of the system provides the essential information required to regulate the system behavior and is also used for the on-line identification of the system design by tracing the code execution of an operational system as shown in procedure 7.
Specify, for each user type, an observation process used to monitor system aspects which are significant to the particular user type. Information exchange during the observation process provides the means by which the observer develops a better comprehension of the system. Various observation model types are further aggregated into a minimum observable and controllable model supported by a minimum static object model as shown in procedure 5.3.
Correlate all information associated with a named proper system across all phases of the system life cycle including requirements, design, implementation, and maintenance phases. In other words, at each phase of the life cycle, each ALI_Net associated with each proper subsystem provides a mechanism for capturing evolving design details of the static/dynamic relationships of the proper subsystem components. It follows that at each phase of the life cycle the components of each proper subsystem and their static/dynamic relationships, can be readily identified, visualized, tracked, and isolated from other proper subsystems.
The following procedure uses the above definition to specify the ALI_Net design control scheme of a multi-layered distributed application systems:
First, for each two sets of “cyclic input and output” interactions between the system internal and external objects, see FIG. 62, a directed graph called an object_loop is specified where:
An object_loop specifies the interconnection between a set of one or more “loop terminal input” resource regions, and a set of one or more “loop terminal output” resource regions. These sets include the set of persistent internal system resources. These resources are maintained by the ALI_Net control modules to ensure the reliable fault tolerant operation of the specified subsystem. Input and output edges connecting loop body with its terminal resource regions are called external loop edges. All other loop edges are called internal loop edges. These edges are used to specify required connection between internal systems.
Cyclic input set implies that the set of all loop terminal inputs, specifying the external information required to perform loop functions, are input to the subsystem once at the beginning of a complete cycle. Two subsets of loop terminal inputs are specified: the first subset is the subset of inputs provided by external system objects and the second subset is retrieved from the system internal persistent data base.
Cyclic output set implies that a complete cycle of the system produces internal interactions and any element of the set of loop terminal outputs can be expressed as constants at the end of the loop cycle. Two subsets of loop terminal outputs are specified: the first subset is the subset of outputs transmitted to external system objects and the second subset is stored in the system internal persistent data base.
By satisfying the above conditions it follows that all occurrences within the boundaries of an automated subsystem are internal interactions with no external interactions, with its outer environment (both human operators and automated external systems), during one complete loop cycle.
As shown in FIG. 62, a set of coupled object loops are aggregated to form an ALI_Net. ALI_Nets are subsequently aggregated to compose the System Design Control Scheme. Aggregation operations are carried out using the cascade and parallel aggregation structures shown in FIGS. (64-67).
Second, each object_loop may be specified as a closed or an open loop; an object loop that begins and ends with the same region is called a closed loop; a loop which does not satisfy the closed loop condition is called an open loop, see FIG. 63. Furthermore, loop category is designated as an Application Processing loop, a Fault Diagnostic loop or a Control loop. An Application Processing loop or a Fault Diagnostic loop is determined by the presence or absence of control actions required to regulate the quality of system services provided by the system. As shown in FIGS. (63-a, b), Lk and Lk — d are closed control loops because system operators and automated system control actions are dependent on measurements of system outputs. Although Lk is a closed loop, it is not a control loop because the control action necessary to maintain the quality of the processing loop products/service is not dependent on loop Lk outputs. Closed process loops provide the basic structure for the sequential nesting of a set of two or more object_loops (subsystem fragments) into subsystem_loops. On the other hand, Li is an open control loop, FIG. (63-c), because system operators and internal system control actions are independent of system output values.
Third, aggregate object_loops into one of the following three structures:
Cascade loop aggregation structures: These structures are used to specify the sequential nesting, loop chaining, of a set of two or more loops such that the terminal inputs of each loop, excluding the first loop, are set by external systems using values of the terminal outputs of the preceding loop as shown in FIGS. (64 and 65).
Parallel loop aggregation structures: These structures are used to specify a concurrent set of upstream subsystem loops, loop decomposition, triggered by a set of cyclic terminal inputs, with a down stream set of subsystem loops. The terminal inputs of the down stream fragments are set by external systems using the combined values of the terminal outputs of the upstream fragments as shown in FIGS. (66 and 67).
Mixed loop aggregation structures: These structures are used to specify the sequential nesting of a set of two or more loops where the internal structure of each of these loops may have a parallel aggregation structure.
Fourth, for each of the above loop aggregation structures, identify the type of coupling and interaction between the component objects of a named set of object loops. Four types of coupling may be identified:
Object Occurrence Coupling when the same object instance is invoked (i.e. shared) by multiple loops.
Message Coupling when the same event, or message instance is used to invoke objects of more than one loop.
Object Attributes Coupling when global variables, used in some object oriented programming languages, are shared among the object instances of more than one loop.
Physical objects coupling when information system objects of more than one loop share physical system objects such as memory processors.
Fifth, each set of coupled object_loops is aggregated into an ALI_Net structure. By coupled loops, we mean object loops whose components satisfy one or more of the above coupling conditions. The set of regions shared between the component loops of an ALI_Net specifies behavioral dependencies between the coupled set of object loops.
Sixth, compose each object loop Ln as an ordered set of multilayer component loops where Lnj designates the jth layer component of the loop Ln as shown in FIGS. 68 and 69. Each layered component loop is triggered when the services of an object belonging to the designated layer are invoked. The annotation of various sub-loops of the multi-layered distributed application systems is optionally displayed using the following convention:
<ALI_Net_Edge_Identifier>::=<ALI_Net_Identifier>
{<Object_Loop_Identifier_List>}
<Object_Loop_Identifier_List>::=<Object_Loop_Identifier>
<Layer_Identifier><Edge_Identifier_List>
<Edge_Identifier_List>::=<Edge_Identifier>{, <Edge_Identifier_List>}
<Edge_Identifier> is defined using loop communication constructs as shown in FIGS. (73-77). As shown in these figures, object_loops may fork or branch only at an object or a method region Δ. If the loop fork condition is an AND then all output edges are annotated with the identical loop Id name as the input edges of the loop. On the other hand if the loop branching condition is an OR then the loop ID name of each possible output edge is augmented with an additional unique sub-loop id name.
Seventh, specify each layered component loop by an ordered set of pipe connections between system objects allocated to the designated layer as shown in FIG. 69. Each of these system objects may be implemented using run time system environments such as Microsoft's COM objects or Object Management Group's CORBA objects. As shown in FIG. (70-a, b), each COM or SOM object is represented by a geometric region within which the component objects are embedded as shown in FIG. (70-c). An object public interface region contains a list of methods (e.g. vtable pointers) supported by the interface as shown in FIG. 71. In accordance with the CORBA or ActiveX rules, all interactions between the component objects of a loop occur only by invoking object operations, and objects execution only affect system resources allocated to the object. Two types of object interaction structures are defined:
Operation chaining structure occurs when an operation on one object triggers the invocation of an operation on another object This chained operation may in turn cause another operation to be invoked (see loop Ln of FIG. 72).
Operation decomposition structure occurs when an operation on one object triggers multiple operations on other objects. The result is a hierarchical processing tree with the owner object performing the initial operation at the root of the tree; each subordinate operation must be completed before its superior operation can finish, and coordination among subordinate operations may be required (see loop Lj of FIG. 72).
Eighth, bind system object components into object loop structures using a compound connection where the fractal structure of the pipe region is partitioned into one object region called the communication binding region and three resource regions called send request, receive request and message specification resource regions as shown in FIG. 73. Allowed interactions are specified by an object message protocol as specified in its message interface shown in FIG. (71-a). A message protocol specifies the syntax and semantic of object operations supported by the message interface. Behavior of the communication binding objects is a result of the supported loop communication semantics where the interactions between loop objects engaged in a pipe connection are regulated using:
Synchronous mode with the invoked object operation returns Result or Error.
Asynchronous mode with the invoked object operation returns Result or Error.
Synchronous mode with the invoked object operation returns Error (if any).
Asynchronous mode without return from the invoked object operation.
As shown in FIG. 73, asynchronous communication is represented by a directed edge from the invoking object to the object containing the invoked object operation where the sequenced symbols ♦ are used to specify communication and execution order. On the other hand synchronous communications are represented by a bi-directed edge which represents the synchronous return condition of Result or Error (if any). Asynchronous and synchronous pipe connections are specified using the following four basic communication constructs. These constructs provide visual geometric representation of loop communication semantics as follows:
Basic_Communication construct shown in FIG. (74-d) provides an aggregated geometric representation of the two basic interactions of the connected objects with the communication binding object.
Loop_Fork_Communication construct shown in FIG. (75-d): For a named loop, the Loop_Fork construct generates two or more concurrent computations as specified in the signature of the send request. As shown in FIG. (75-d), edges specifying the trigger of the two forked computations Oq and Or are annotated with the identical loop annotation to the input edge to the Op computation.
Loop_Branch_Communication construct shown in FIG. (76-d): For a named loop, the Loop_Branch construct triggers only one of two or more concurrent computations. Selection of which computation to trigger is specified in the signature of the receive request. As shown in FIG. (76-d), the annotation of each output edge is concatenated with a sequential index number specifying the subloop name.
Loop_Join_Communication construct shown in FIG. (77-d): For a named loop, the Loop_Join construct is used to specify the combine of two or more upstream computations performed by concurrent system objects into one concurrent down stream computation. As shown in FIG. (77-d), the Od computation will halt until all input edges with the same loop annotation are enabled. This implies that the Od will not perform any loop Li functions until both Mk and Ms conditions are enabled. On the other hand the Lm functions will be immediately triggered by the enabling of the Mk condition.
Ninth, a multi-layer specification of system loops is generated by manual or automatic tools as shown in FIGS. (78-82) where:
The elevation and plan projections of the two object loops system of FIG. 72 example are shown in FIGS. (78-80).
The loop wiring diagram of the two object loops system of FIG. 72 is shown in FIG. 81. In this diagram, the sequence of loop connections is specified at the message invocation connection points and the list of component objects are monotonically sorted by their layered id.
A complete specification of system interconnection loops is carried out using the container objects interconnection diagram of FIG. 82 where the intra connections of the contained objects are specified using the lower level contained objects wiring diagrams
Tenth, the multi-layered loops of each ALI_Net, shown in FIG. 69, can be arranged to display the isomorphic ALI_Net dynamic graph shown in FIG. 83. This new type of graphs enable the visualization and analysis of the subsystem dynamics specified by an ALI_Net. As shown in FIG. 83 loop harmonics at each layer are computed by the superposition of the harmonics of its component loops at the lower layer.
Eleventh, define for each ALI_Net the set of metrics used to measure the operational effectiveness of the proper subsystem represented by the ALI_Net, predict the impact of resources allocation or design changes on quality of service provided by the proper subsystem and its financial results. As shown in FIG. 84, four major categories of metrics are used:
Quality of Service/Customer Profile Metrics. These metrics measure customer satisfaction relative to competitors, customer retention, market share gain, customer complaints, etc. Products/services quality metrics measure compliance to industry standards, creation of innovative products, etc.
Financial Metrics. These metrics evaluate the cost/profit of delivering products or services created by the proper subsystem. Financial metrics include unit cost of each resource type.
Resource Utilization Metrics. These metrics include human resources metrics which measure human labor requirements and skills; equipment resources, computer hardware and software resources.
Operational Metrics. These metrics include process cycle time, idle time, wait time, throughput rates, work in progress, inventory levels, defect rate, error rates, resources levels. These metrics evaluate the efficiency of transforming process inputs (raw materials) into physical products. Other operational metrics include information metrics which evaluate the value of information generated by the proper subsystem.
The above metrics are used to construct an ALI_Net Business Tracking Graph as shown in FIG. 85. In this figure there is an overall system desired operating region and a set of ALI_Net actual performance regions. Each of the latter regions specifies the contribution of the specified net to the overall performance of a real system. For each type of variable, deviations of measured variables from desired system behavior can trigger automated run time system control actions of the AMR control schemes as shown in procedure 5.3 or system operator control actions. The latter type of control is facilitated by the business tracking control graphs. As shown in procedure 6, these graphs provide system operators and business managers with visual criteria for identifying and correlating the causes of both technical and/or financial performance problems.
Twelfth, use ALI_Nets to specify a minimum observable semantic model of the dynamic architecture of a real system where:
By a semantic model, we mean that the system model is specified and constructed such that: see FIG. 86
All ALI_Net model functions and input/output signals, represented by ALI_Net messages, have a meaning. This implies that the meaning of each aggregated message and each function should correlate in some sense with that which is within the cognitive models of the human sender and receiver.
By meaning, we mean that the ALI_Net operational requirements architecture model, should be consistent, i.e. match, the cognitive model of a class of human system users. By cognitive model, we mean an image of a segment of the real world which is of interest to the observer where all remaining segments are called the environment. This model consists of a set of assertions, that must be related to the real world where each assertion consists of a subject related to the matter of the statement, and a predicate which positively qualifies the subject.
By an observable model, we mean that a system is observed by one or more external user types. External users include all automated systems and human users that are not included within the system boundary. These users reside in the External System region named XS as shown in FIG. 34. Associated with each user object type, there exists a set of ALI_Net loops, each of which specifies a dynamic relation between an n-array of system objects (Om, . . . , Oz) and the user object type. As shown in FIG. 87, each ALI_Net defines the observation process used to observe certain aspects of the system under investigation. During the observation process, the ALI_Net loop terminal input/output regions provides the means by which the observer develops a better comprehension of the system. As shown in FIG. 87, comprehension is developed using the external user's own semantic framework, as defined by his or her conceptual model, which acts as a substratum space for the information contents of the ALI_Net message flow between the system and a given user object type.
Since an ALI_Net is defined only with respect to a given user type, called an observer, who observes that part of the whole system which he/she wants to investigate and/or manipulate, then each part of a system may be observed by one or more user types. It follows that multiple ALI_Nets may be associated with the same dynamic segment of a given system. Each of these nets must be tailored to match the human conceptual model of a given user type as shown in FIG. 86.
The above definitions are used to specify minimum observable “semantic” object systems using a minimal set of loops, called System ALI_Net Basis S(A_B) and System Object_Loop Basis S(OL_B) such that: see FIG. 88
If (L1, L2, L3, . . . Ln) are the elements of S(A_B) and,
If (g1, g2, g3, . . . gk) are the elements of the set of rules used to generate the set of aggregated ALI_Net loops. Each set of these aggregated loops, L(uk) is required to observe information which matches the conceptual model semantics of the user type uk and,
If L(uk, n+1)=g1(L1, L2, L3, . . . Ln), then
L(uk, n+1)∈L
where L is the set of all ALI_Net loops required to observe the system under investigation
Similarly each ALI_Net is generated using elements of the S(OL_B) basis.
Procedure 5.2.2: Geometric Specification of an Integrated Architecture
Since at the highest level of aggregation ALI_Nets specify system behavior, it follows that these nets provide an interpretive framework used to:
Elaborate system operational requirements architecture, design control architecture, and implementation architecture shown in FIG. (89-a)
Ensure that an evolving system design, with increasing levels of design and implementation details, complies with the intended operational requirement goals of a given ALI_Net. At various phases of the systems life cycle, an ALI_Net provides an invariant structure to evolving system design and implementation details.
Generate an integrated architecture of a real system using the following four step procedure:
First, use procedures 5.3 and 7 to specify and edit the semantics of each ALI_Net loop in a manner that matches the conceptual model of the system end users. The operational requirements model generated by this activity specifies the system operational requirements architecture. This architecture consists of the set of ALI_Nets, each of which specifies the highest level of system behavior required to realize business missions. Required system behavior is defined by the dynamic relationship constraints of each ALI_Net as shown in FIG. 114
Second, use procedures 5.3 and 7 to create the inner design specification of the system operational requirements architecture as shown in FIG. (89-b). The set of design control loops, required to realize the operational requirements of each ALI_Net, specifies the system design control architecture. Each design control loop is an object loop which:
specifies, the programming language independent, interconnection of internal system objects
complies with ALI_Nets loop semantics and satisfies its dynamic relationship constraints
encapsulates an information access loop as shown in the next step
Third, the semantics of each ALI_Net loop, and its component object loops, is specified to match the conceptual model of a loop user type. Each conceptual model consists of a set of assertions. Each assertion consists of a subject and a predicate. Taken together, the “subject/predicate” provides a description of the data attributes of an object as it appears in reality. Relationships between these data entity types are captured by object relationship models, semantic network models or entity relationship models. Access to different types of information referenced by these models is specified using a special type of loops called Information Access Loops (IAL), see FIG. 90. These loops provide a visual specification of the query processing of data base systems as follows:
An information access loop consists of two loop segments called “Forward and Backward” loop segments. The forward segment is specified by a sequence of one or more functions (representing a connected set of entity relationships). The backward segment is specified by a sequence of one or more functions, each of which is an inverse of the forward loop functions.
The data base can be viewed as a set of stored functions where one function is defined for each entity attribute. Given an entity identifier as a parameter, each function returns the value of the appropriate attribute. Given a data base, with entity types E1, E2, E3, . . . , En, a relationship between E1 and E2 specifies a function which returns an entity occurrence of type E2 when given the attribute value of an entity occurrence of type E1.
Geometric representation of information access loops are constructed according to the following rules as shown in FIG. (90-c):
Entity types (data types), which are depicted, on the object relationship models, semantic network models or entity relationship models, by a rectangle, are represented by the geometric region symbol ∇. These regions can be hierarchically decomposed, into component regions representing lower level subtypes, using the construction rules of procedure 2.
Entity or object type relationships (or associations) depicted on the relationship diagrams by the symbol ⋄ are represented by the geometric region symbols Δ.
An information access loop is specified by an ordered set of edges connecting a set of Δ geometric regions. These loops specify the relationship between an n-ary relationship describing the association among n set of entities.
The information access loops of an entity relationship model can be further encapsulated into an object relationship model as shown in procedure 3.
Fourth, generate design implementation loops code by binding design control loops to a programming language and a given object class library. Each design implementation loop is an object loop. The syntactic design/implementation specification of this loop is generated using a selected programming language grammar.
The integrated architecture specified using the above procedure defines two major categories of application objects namely Mechatronic objects and Infotronic objects as shown in FIG. 91. As shown in FIGS. (92-94), each of these objects is a container object whose structure is specified using “Has_A” and, or “Knows_A” relationships with a selected components of the three multi layer stacks of the system infrastructure objects. Infrastructure objects are specified, designed and manufactured in accordance with the selected open system interconnect reference model. This model, called the technical reference model architecture, defines the rules and regulations i.e. protocols that govern interconnection and interworking among layered system objects. As shown in FIG. 92, three categories of physical system resources are encapsulated by the three layered stacks of system information objects:
The first category of physical resources includes intra-node computer devices such as discs, displays, and tapes. These resources are managed by the multilevel stack of data processing controllers consisting of device controllers (e.g. disc controllers), device managers (e.g., file managers), and supervisory data processing managers (e.g. distributed data base managers).
The second category of physical resources includes inter-node communication devices such as communication channels. These resources are managed by the multilevel stack of controllers consisting of communication controllers, communication protocol control managers, and supervisory network managers.
The third category of physical resources includes material or energy transformation devices such as chemical reactors, heat exchangers or radar antennas. These resources are managed by the multilevel stack of plant controllers consisting of discrete time controllers such as proportional integral derivative algorithms, plant event managers which compensate for system nonlinearities and saturation effects, and supervisory equipment mangers.
It follows from FIG. 92 that the three stacks of infrastructure objects have a similar structure where:
Lower layer objects of each stack are used to regulate the dynamic behavior of the stack physical objects. Network and computer physical objects are managed using discrete event algorithms or protocols. On the other hand equipment physical objects are regulated using control algorithms of broad applicability such as a PID algorithm. The parameters of these algorithms are adjusted to values that will result in an optimum closed-loop response of the physical objects. This type of continuous control can be applied when environmental disturbances result in a small change of the value of the physical process parameters such as its energy. However, because of the non-linear and time varying nature of the plant entities, coupled with changes in the operating conditions (due to changes in set points, etc.), the performance of the controller will degrade with time. Therefore to maintain good performance, the controller parameters must be adjusted from time to time. When large soft and catastrophic failure disturbance events occur, the required corrective action can be beyond the control range of the continuous controller. As a consequence, the plant parameters will cross pre-specified limiting values. This results in switching off the process and execution of higher level discrete event control algorithms which manage the transitions between system states such as normal, emergency, off, etc.
Higher layer objects of each stack contain lower level objects and provide additional discrete event algorithms. For the network and computer stacks, discrete event algorithms are used to control startup, shutdown, and failure recovery of system physical and information processing objects. Other functions include control of the generation, dissemination, storage, and retrieval of distributed system information. For the equipment stack, discrete event algorithms are used to compensate for the non-linear and time varying nature of physical objects.
The multilayer design of each stack of objects induces an ordering with respect to the time scale; specifically, the statistical mean period of the control loop action tends to increase as we proceed from a lower to a higher level of the control system hierarchy.
By applying procedure 2 rules, elevation and plan projections of the three infra structure stacks can be developed as shown in FIGS. 93 and 94. Both projections can be integrated using the geometric cellular structure shown in FIG. 95.
By applying entity access construction rules to specify the connectivity of hardware resources, the fractal structure of the application processing scheme encapsulates the hardware resources as shown in FIG. 96. This figure provides an example of three concurrent user objects, executing on a two hardware processors system. As shown in FIG. (96 a-c), the two hardware processors region is totally contained within the three objects resource region. Different views of the software/hardware processing scheme can be generated using the Region Display Setup options of procedure 7.
As shown in FIGS. 97 and 98 the above rules can be applied to generate a geometric representation of systems whose architecture is specified by a stack of layered objects at each node.
The geometric regions of the integrated system static/dynamic architecture at each time instant t are mapped on the physical space required to house system objects such as memory for computer implemented objects or the physical space occupied by physical objects such as sensors, or equipment. The physical space is represented by the Euclidean or Riemann geometry. This mapping is carried out as follows:
The state space structure of each object region is folded into a multi-dimensional tetrahedron, octahedron, dodecahedron, or icosahhedron structure which is mapped onto the Euclidean/Riemann “Multi_Node” physical space grid and the memory space grid within each node as shown in FIGS. 99 and 100. This mapping is carried out using procedure 2 folding/unfolding rules. Mapping operations are supported by tools specified in procedure 7. These tools enable system designers to allocate object instances to various system nodes where a node is defined as a shared set of physical memory regions. Code compilation tools assign memory regions to various elements of the virtual system grid.
The Euclidean three dimensional space represented by the Cartesian coordinate (x, y, z) is partitioned into a three dimensional set of cells as shown in FIGS. 100 and 101. In this representation each object may occupy a set of one or more cells in a single or multiple planes of the three dimensional physical space. Each of the physical space cells is identified by a unique set of latitude and longitude parameters.
Procedure 5.3: Geometric Specification of an AMR Control Scheme of a Real System
In this procedure, infotronic and mechatronic objects models, created using procedures 5.1 and 5.2, are used by system planners, configurators and operators to: (see FIG. 102)
First, plan and schedule various operational missions supported by an operational system as shown in procedure 5.3.1.
Second, plan and schedule human and physical objects of a real system as shown in procedure 5.3.2.
Third, configure an automated system adaptive control scheme. This scheme is used to monitor, control, and sustain the run time behavior of an operational real system as shown in procedure 5.3.3.
Procedure 5.3.1: Geometric Specification of Real System Plans
Plans of a real system are constructed using the planning process shown in FIG. 103 where:
First, an ALI_Net operational architecture model of desired business missions is constructed using procedure 5.2 and procedure 7 tools. Instances of each ALI_Net specified in the operational architecture is created using tools described in procedure 7.
Second, the geographical allocation of mechatronic and infotronic objects, referenced by the operational architecture, is specified by dragging each object, and/or a specified set of its ALI_Net segments, onto the three dimensional cellular space as shown in FIG. 104. Routing, by Euclidean position, of each mechatronic object position is specified by an initial position, an end position, and an intermediate set of way points. Processing conditions of the specified ALI_Net segments at each routing point are monitored and used by the AMR scheduling algorithm to control the motion of the mechatronic object.
Third, specify geographical constraints associated with the routing of mechatronic objects using the three dimensional cellular space shown in FIG. 105. These constraints are used by the AMR scheduling algorithms to generate a pre-mission position routing plan such as those shown in FIG. 105 or use these constraints to automate and adapt the motion of the infotronic objects using run time sensor measurements. AMR algorithms associate with each cell a number which represents the time, distance or fuel cost associated with arriving to the end position from the referenced cell. During run time the AMR scheduler uses this information to invoke the movement of the object to the neighboring cell with the lowest value. This movement will be carried out if and only if the processing conditions of the object ALI_Net segments at the given set of cells are satisfied.
Fourth, procedure 7 tools use object transportation functions, shown in FIG. 106, to implement routing plans of mechatronic objects. Similarly routing of system messages between mechatronic and infotronic objects is realized using procedure 5.2.1 as shown in FIGS. 107 and 108.
Fifth, as shown in FIG. 103 all information required to perform the above steps are supported by the AMR knowledge manager specified in procedures 7 and 8
Procedure 5.3.2: Geometric Specification of Human & Physical Object Schedules of a Real System
Scheduling of human and physical objects is carried out using the process shown in FIG. 109 where:
First, generate a set of ordered instances of organizational and mechatronic resource objects that may be used to execute specified functions/methods of each set of one or more instances of the ALI_Net.
Second, use procedure 7 tools to generate a prioritized list of human and mechatronic object instances to perform required business missions. Use this list to generate required schedules.
Third, created schedules can be directed, implemented, monitored, controlled and adapted by the run time tools of procedure 7.
Fourth, as shown in FIG. 109 all information required to perform the above steps is supported by the AMR knowledge manager specified in procedures 7 and 8.
Procedure 5.3.3: Geometric Specification of an AMR Control Scheme of a Real System
An AMR control scheme of the automated information system components of a real system is constructed as follows: see FIGS. (110-112)
First, as shown in FIG. 111, an AMR control scheme of an automated information system is composed of a set of analogue/digital controllers which manage interfaces with external physical objects, a set of views each of which is tailored to the semantic requirements of a specific end users type, and adaptive view controllers which regulate the update of user type views using the AMR supervisory control model.
Second, as shown in FIG. 112 the AMR control scheme of the automated information system is constructed using two types of system control models: an AMR Concurrent Application Control Scheme, as shown in procedure 5.3.3.1, and an AMR Supervisory Control Scheme, as shown in procedure 5.3.3.2. The first scheme is constructed in the manner described in section 5.2.1. The second scheme is constructed using the distributed system ALI_Net Supervisory Control loops. The two schemes are embedded in FIG. 111 model to compose the automated system AMR control scheme as shown in FIG. 113.
Procedure 5.3.3.1: Geometric Specification of an AMR Concurrent Application Control Scheme
An AMR Concurrent Application Control Scheme is constructed as follows:
First, specify the dynamic relationship constraints of each ALI_Net referenced in the integrated architecture model. Dynamic relationship constraints of this model are specified using the following set of attributes as shown in FIG. 114:
(a) Configuration Control attributes which consist of:
Loop name.
Software/Hardware allocation (e.g. node name, processor name, and concurrent process names allocated as resources required to execute the named loop). Values of these attributes may be set by a human operator or dynamically assigned by the AMR_Configuration_Controller during run time operation.
(b) Quality Control attributes which consist of:
Security control attributes such as access rights for each user type and each instant of a user type. Access right values include No_Access or Access to a named ALI_Net, a component object loop, a named object_operation or a data structure. Access rights are further constrained to deny making any changes to the system configuration, quality and performance control parameters.
Reliability control attributes. Desired communication system semantics such as atomic broadcast, causal broadcast or group broadcast protocols. In this invention these protocols use the system ALI_Net graphs as the context graph required to preserve the partial ordering of messages exchanged among a collection of concurrent processes in the presence of communication and processor failures.
Accuracy control attributes (equality, inequality, and discrete optimization constraints).
Loop invariants which state common preconditions on all loop operations. Invariant conditions on the loop state are established by the object_initialisation operation and are preserved by subsequent loop operations including failure recovery operations.
Performance Control attributes. These attributes are used to specify the service time distribution of system component objects, the invocation frequency of each ALI_Net loop, each of its object loop components, and the desired response time distribution. Furthermore each loop can be classified by system configurators as critical, essential, or nonessential and each can be assigned a time based value function. Critical loops are those with hard response time deadlines which must be achieved under all operating conditions. Essential loops are those with soft response time deadlines, which if not achieved will not cause a catastrophic system failures. Nonessential loops are those with response time deadlines, which if missed will not affect the system in the near future such as long term data recording. A loop category determines its share of available system resources. For each category three types of performance control attribute values are defined: required, measured, and predicted. These attributes are measured, predicted and used to control quality of delivered products and services as shown in procedure 5.3.3.2 and procedure 7.
Second, loop parameters specified in the last step are accepted and used by the distributed set of the system AMR Supervisory controllers to create the AMR Loop_Process data structures shown in FIG. 115. These structures are used by the AMR controller objects of each concurrent application control process as shown in procedure 5.3.3.2.
Inter_Process_Loop_Connectivity_Graph: This graph specifies the “enable/disable” state of each ALI_Net as well as the interconnections between the terminal input/output regions of various ALI_Net_Process_Segments required to execute each object_loop of each ALI_Net. The Inter_Process_Loop_Connectivity_Graph is used by the AMR_Reliable_Communication controllers and the AMR_Activation_Reply_Forward controller.
Intra_Process_Loop_Connectivity_Graph: This graph specifies each subset of each ALI_Net graph (called ALI_Net_Process_Segment) allocated to the named process. This segment specifies interconnections between intra-process objects, some times called component objects of the container object i.e. process, required to execute each object_loop of each ALI_Net allocated to the named process. The Intra_Process_Loop_Connectivity_Graph is used by the AMR_Base_Scheme controller.
Loops/Objects_Invocation_Queues.
Loops_Monitoring_Control_Parameters.
Resources_Monitoring_Control_Parameters.
Performance_Control_Parameters.
Security_Control_Parameters (Loops/Objects_Access_Rights).
Reliable_Communication_Parameters. These parameters specify causal ordering options.
Loop_Control_Flags: Six AMR flags are defined:
PR Indicates that Performance Control option is set
RC Indicates that Security control option is set
RC Indicates that Reliable Communication control option is set
RM Indicates that Resource Monitoring control option is set
LM Indicates that Loop Monitoring control option is set
LS Indicates that Loop Scheduling control option is set
Third, application processing objects are allocated to concurrent application control processes. This allocation can be dynamically changed by the AMR run time system environment. As shown in FIG. 118, each AMR concurrent application control process contains two sets of objects; concurrent controllers object set and application processing object set. As shown in FIG. 119, the following set of concurrent controllers objects use the AMR_Loop_Process data structures, shown in FIG. 115, and the AMR_Message_Header, shown in FIGS. 116 and 117, to interconnect and synchronize the application processing objects within each process as well as between concurrent processes.
AMR Reliable_Communication Controller: When an application processing object is invoked, this controller uses the AMR_Message_Header, the Inter_Process_Loop_Connectivity_Graph, and the Reliable_Communication_Parameters to check if processing of the received message can be handled by the process and that the message is received in compliance with the casual ordering specified in the Inter_Process_Loop_Connectivity_Graph. IF the received message was sent to the wrong process, THEN the requested invocation is rejected, red edge 1-a and the supervisory configuration and security controllers are notified ELSE transaction manager services, e.g. CORBA, COM/OLE, etc. services, are used to lock the application processing object. If the object is not locked then the invocation is handed over to the security controller, black edge 1-a. On the other hand if it is locked then, depending on selected configuration parameter options, the requested invocation is returned to the input process queue or is rejected, red edge 1-a.
AMR Security Controller: This controller uses the Security_Control (process Loop_Objects Access Right) data structure to determine if the invoker, at this stage of the aggregated ALI_Net loop, is authorized to invoke all object operations of the named loop or can only invoke a named subset of these operations. In addition this controller invokes the decryption functions using the private key assigned to the current session assigned to the current Object_Loop. If the request is authorized then the request is inserted in the process Loop_Object Invocation Queues, black edge 1-b, else the request is rejected, red edge 1-a.
AMR Activation Controller: This controller uses the Loop_Objects Invocation Queues and the Intra_Process Loop Connectivity graph to activate the thread manager to create a new thread and link it to the requested loop operation. After termination, the Reply_Forward function sends operation results to invoker in compliance with the invocation service protocol. On completion of the process thread operations, the Reply_Forward functions provide the necessary wrapper and invoke communication object, see FIG. 91, to route messages to other process objects in accordance with the Inter_Process Loop Connectivity graph. Invoked objects may reside on the same or different stations of the distributed system.
AMR Concurrency Controller: This controller manages the synchronization of shared resources and management of the process invocation queue. It creates, deletes, suspends, resumes, and schedules object threads. Scheduling of thread objects is determined using AMR message header, process state, and the set of object preconditions (predicates) specified in the Intra_Process Loop Connectivity graph
AMR Reliable_Configuration Controller This controller accepts process configuration control parameters from the AMR supervisory controller and uses these parameters to set the AMR Loop_Process data structure parameters shown in FIG. 90. On a hot restart/resume of operations, following a system failure, the AMR Reliable_Configuration controller restores from secondary memory all process persistent data for each object loop allocated to the named process. During the normal processing of process functions, all edits to named persistent data used by various object loops are automatically stored on secondary memory by the object manager encapsulating the named persistent data. In addition an AMR configuration controller uses monitored ALI_Net communication loads to edit the AMR Loop_Process data structures. This is carried out such that processes with heavy message communication are automatically migrated to reside on the same hardware node. This will result in reducing loading of the communication network infrastructure.
AMR_Monitoring Controller: In accordance with the AMR Supervisory Controller Process requests, this controller collects and dispatches Process and Loop state information to the Supervisory Controller Process, see FIGS. 120 and 121. The AMR Monitoring Controller:
Monitors utilization of system hardware resources such as processor utilization and memory utilization by different concurrent objects.
Selectively records interactions between different concurrent objects. Recorded data includes invocation time of operating system services, attribute values of invoked services such as the identification name of sender or receiver object, service time used by the operating system to execute desired service and the program counter identifying the state of the concurrent object invoking the system service.
Use recorded data to identify the concurrent object automata, i.e. internal processing control loops of the concurrent object. This specification is derived at the granularity of interfaces of the concurrent object with the operating system. The object automata identification algorithm reduces recorded data to generate statistical estimates of the service times elapsed between each ordered pair of states of the concurrent object. These states are specified at the points of interactions with the operating system. The object automata identification algorithm may be invoked during run time when the operating system service calls are invoked. In this invention it is assumed that the necessary data required to identify the concurrent object automata will be collected using run time monitoring services provided by operating system vendors.
Create Performance Relationship Displays associated with different processing control loops as specified in procedure 5.1.2. This is carried out by invoking methods of the views object, shown in FIG. 111. These methods generate views of processing loop display outputs. These displays are tailored to specific user types.
Fourth, Pipe connections are used to bind distributed concurrent system objects into dynamic loop structures as shown in FIG. 122. In this figure the fractal structure of object communication model, see FIG. 73, is aggregated with the concurrent process structure to form the aggregated concurrent object communication model shown in FIG. 122.
Procedure 5.3.3.2: Geometric Specification of an AMR Supervisory Control Scheme
An AMR Supervisory Control scheme is constructed as follows:
First, three sets of supervisory control loops are specified as shown in FIGS. 120 and 121. The first set of loops, designated by the blue color, are used to monitor the system physical resources; configure and control the allocation of these resources to application concurrent processes. The second set of loops, designated by the red color, are used to monitor, configure and control the allocation of each application_specific processing loops to one or more concurrent processes. These processes may be allocated to one or more nodes of the distributed hardware system. The second set of loops control the scheduling of available system resources to serve the run time operational needs of monitored concurrent processes. The third set of loops, designated by the black color, are used to coordinate and synchronize the multi-node set of AMR supervisory control processes. These loops broadcast desired control requests, of a named set of ALI_Net loops, to all AMR supervisory control processes residing on each system node involved in the processing of the named loops. If a performance exception is raised about a named ALI_Net, then coordination control requests are exchanged between peer AMR supervisory control processes.
Second, each AMR supervisory control concurrent process has two sets objects, see FIG. 123, the concurrent controllers object set, as shown in FIGS. 118 and 119, and the supervisory controllers object set. Control roles played by the supervisory controller objects are shown in FIG. 124 as follows:
AMR Overload_Monitor. As shown in FIG. 125, this monitor uses the Node Process and Loops state data structure to update the AMR Temporal_State data structure. This data structure maintains state information about each ALI_Net loop and its implementation by the distributed system concurrent processes. Six major sets of variables are tracked by the monitor namely Loop_Response_Time, Loop_Response_Time_Remaining, Loop_Load, Loop_Service_Time, Resource_Utilization and Loop_Accuracy. The current value of the state variable and its estimated deviation, i.e. error, from a desired set point at the point of measurement is carried out using the Loop_Cycle time window specified in FIG. 126. The time Duration of Loop_Cycle_Window Cx for all x is set equal to the maximum of the Loop_Response Time_Desired for all loops.
The first set of measurements, Loop_Response_Time (LRT), is used in the following procedure to compute the Loop_Response_Time_Set_Point for each loop_component_object Om of loop Ln during the current Loop_Cycle Cc
Loop_Response_Time_Set_Point (Ln, Om, Cc)=
Loop_Response_Time_Desired (Ln, Oe)*[Σx=c−1 x=c−1−b({Σj=i−k(x)−1 j=i−1
[Loop_Response_Time_Measured (Ln, Om, Cx, j)
/Loop_Response_Time_Measured (Ln, Oe, Cx, j)]}/k(x))]/b
Such that:
Loop_Response_Time_Measured (Ln, Oe, Cx, j)<=
Loop_Desired_Response_Time (Ln, Oe)
Where:
Loop_Response_Time_Measured (Ln, Om, Cx, j) is the measured response time for the jth invocation of loop Ln after the execution of object Om during the xth Loop_Cycle Cx
k(x)=Number of invocations of loop Ln during the xth Loop_Cycle Cx
Oe=End terminal component object of loop Ln generating Ln terminal outputs
c=Current loop cycle
b=Number of loop cycles included in the computation where each cycle x have the same set of loops that are invoked in the current cycle
The above formula is used to compute the LRT_Error set:
Loop_Response_Time_Error (Ln, Om, Cc, i)=
{Loop_Response_Time_Measured (Ln, Om, Cc, i)−
Loop_Response_Time_Set_Point (Ln, Om, Cc)}
Loop_Response_Time_Delta_Error (Ln, Om, Cc, i)=
{Loop_Response_Time_Error (Ln, Om, Cc, i)−
Loop_Response_Time_Error (Ln, Om, Cc, i−1)}
Loop_Response_Time_Differential_Error (Ln, Om, Cc, i)=
Loop_Response_Time_Delta_Error (Ln, Om, Cc, i)/
Loop_Response_Time_Error (Ln, Om, Cc, i)
Loop_Response_Time_Integral_Error (Ln, Om, Cc)=
Σx=c−1 x=c−1−b(Σj=i−k(x)−1 j=i−1[Loop_Response_Time_Error (Ln, Om, Cc, j)/d
Where:
d=Number of loop cycles included in the integral error computation
Loop_Response_Time_Remaining_Error (Ln, Om, Cc, i)=
{Loop_Response_Time_Measured (Ln, Om, Cc, i)−
Loop_Response_Time_Desired (Ln, Oe)}
The second set of measurements, Loop_Load (LL), is used in the following procedure to compute the Loop_Load_Set_Point and Loop_Load_Measured for the current Loop_Cycle Cc:
Loop_Load_Set_Point (Ln, Cc)=[Σx=c−1 x=c−1−b{Loop_Load_Measured (Ln, Cx)
/Σj=1 j=m(x)[Loop_Load_Measured (Lj, Cx)]}/b
where
Loop_Load_Measured (Lj, Cx) (Total number of invocations of loop
Lj during the xth Loop_Cycle Cx/Loop_Cycle_Time)
m(x)=Number of loops used during the xth Loop_Cycle Cx
Furthermore,
Loop_Load_Current (Ln, Cc)=
{Loop_Load_Measured (Ln, Cc)/Σk=1 k=m(c)[Loop_Load_Measured (Lk, Cc)]}
The above formula is used to compute the LL_Error set:
Loop_Load_Error (Ln, Cc)=
{Loop_Load_Current (Ln, Cc)−Loop_Load_Set_Point (Ln, Cc)}
Loop_Load_Delta_Error (Ln, Cc)=
{Loop_Load_Current (Ln, Cc)−Loop_Load_Current (Ln, Cc−1)}
Loop_Load_Differential_Error (Ln, Cc)=
Loop_Load_Delta_Error (Ln, Cc)/
Loop_Load_Error (Ln, Cc)
Loop_Load_Integral_Error (Ln, Cc)=
Σx=c−1 x=c−1−b(Σj=i−k(x)−1 j=i−1[Loop_Response_Time_Error (Ln, Cc, j)/d
Where:
d=Number of loop cycles included in the integral error computation
The third set of measurements, Loop_Service_Time (LST), is used in the following procedure is used to compute the Loop_Service_Time_Set_Point for each loop_component_object Om of loop Ln during the current Loop_Cycle Cc:
Loop_Service_Time_Set_Point (Ln, Om, Cc)=[Σx=c−1 x=c−1−b({Σj=i−k(x)−1 j=i−1
[Loop_Service_Time_Measured (Ln, Om, Cx, j)/
Loop_Service_Time_Measured (Ln, Oe, Cx, j)]}/k(x))]/b
where
Loop_Service_Time_Measured (Ln, Om, Cx, j) is the cumulative service time for the jth invocation of loop Ln after the execution of object Om during the xth Loop_Cycle Cx. Cumulative service time does include any wait time for availability of required resources.
k(x)=Number of invocations of loop Ln during the xth Loop_Cycle Cx
Oe=End terminal component object of loop Ln generating Ln terminal outputs
c=Index of current loop cycle
b=Number of loop cycles included in the computation. Each cycle have the set of loops that are incorporated in the current cycle
The above formula is used to compute the LST_Error set:
Loop_Service_Time_Error (Ln, Om, Cc, i)=
{Loop_Service_Time_Measured (Ln, Om, Cc, i)−
Loop_Service_Time_Set_Point (Ln, Om, Cc)}
Loop_Service_Time_Delta_Error (Ln, Om, Cc, i)=
{Loop_Service_Time_Measured (Ln, Om, Cc, i)−
Loop_Service_Time_Measured (Ln, Om, Cc, i−1)}
Loop_Service_Time_Differential_Error (Ln, Om, Cc, i)=
Loop_Service_Time_Delta_Error (Ln, Om, Cc, i)/
Loop_Service_Time_Error (Ln, Om, Cc, i)
Loop_Service Time_Integral_Error (Ln, Om, Cc)=
Σx=c−1 x=c−1−b(Σj=i−k(x)−1 j=i−1[Loop_Service_Time_Error (Ln, Om, Cc, j)/d
Where:
d=Number of loop cycles included in the integral error computation
The fourth set of measurements, Loop_Resource_Utiliztion_Level (LRUL) such as Queue_Utilization, CPU_Utiliztion, Equipment_Utilization or Human_operator_Utilization levels is used in the following procedure to compute the Loop_Resource_Utiliztion_Set_Point (Ln, Rj, Gk, Cc) of the resource Rj allocated to the Gk operational region to support the execution of loop Ln during the current Loop_Cycle Cc
Loop_Resource_Utiliztion_Set_Point (Ln, Rj, Gk, Cc)=Σx=c−1 x=c−1−b
[{Loop_Resource_Utiliztion_Measured (Ln, Rj, Gk, Cx)/
Σi=1 i=m(x)[Loop_Resource_Utiliztion_Measured (Li, Rj, Gk, Cx)]}/b
where
Loop_Resource_Utiliztion_Measured (Ln, Rj, Gk, Cx)=Maximum utilization level of Resource Rj during loop cycle Cx
m(x)=Number of loops used during the xth Loop_Cycle Cx
The above formula is used to compute the LRUL_Error set:
Loop_Resource_Utiliztion_Error (Ln, Rj, Gk, Cc)=
{Loop_Resource_Utiliztion_Measured (Ln, Rj, Gk, Cc)−
Loop_Resource_Utiliztion_Set_Point (Ln, Rj, Gk, Cc)}
Loop_Resource_Utiliztion_Delta_Error (Ln, Rj, Gk, Cc)=
{Loop_Resource_Utiliztion_Measured (Ln, Rj, Gk, Cc)−
Loop_Resource_Utiliztion_Measured (Ln, Rj, Gk, Cc−1)}
Furthermore,
Available_Resource (Rj, Gk, Cc)=
Allocated_Resource (Rj, Gk, Cc)−
Σi=1 i=m(x)[Loop_Resource_Utiliztion_Measured (Li, Rj, Gk, Cc)]
Loop_Resource_Utiliztion_Differential_Error (Ln, Rj, Gk, Cc)=
Loop_Resource_Utiliztion_Delta_Error (Ln, Rj, Gk, Cc)/
Loop_Resource_Utiliztion_Error (Ln, Rj, Gk, Cc)
Loop_Resource_Utiliztion_Integral_Error (Ln, Rj, Gk, Cc)=
Σx=c−1 x=c−1−b(Σj=i−k(x)−1 j=i−1[Loop_Resource_Utiliztion_Error (Ln, Rj, Gk, Cc, j)/d
Where:
d=Number of loop cycles included in the integral error computation
AMR Learning Controller. As shown in FIG. 127, methods of this object accept as inputs time ordered crisp values of observed system state variables such as the four major set of variables tracked by the AMR_Overload_Monitor. For a given desired prediction distance, and the maximum prediction error which meet the desired quality metrics, the Model Estimation and State Prediction object estimate:
Minimum order of the process model, underlying the observed state variables, which meets the desired maximum prediction error metric
Process model coefficients including model delay
Predicted value, % error, residual error energy at all future time instants from now until the maximum prediction distance, where
Maximum_Prediction_Distance (Ln, Om, Cc, i)=
Loop_Response_Time_Desired (Ln, Oe)−
Loop_Response_Time_Measured (Ln, Om, Cc, i)
State prediction is carried out for measured variables, such as Loop_Response_Time_Measured, Loop_Load_Measured, Loop_Service_Time_Measured, Loop_Resource_Utiliztion_Measured. Loop measurements are collected from a single or multiple invocations of a given loop. In the single invocation case, at the end of execution of current object Om for the current invocation i of loop Lx, the error prediction algorithm accepts as input the response time series
{Loop_Response_Time_Measured (Lx, O1, i),
Loop_Response_Time_Measured (Lx, O2, i), . . . ,
Loop_Response_Time_Measured (Lx, Om, i)}
where
{O1, O2, O3, O4, . . . , Om} is the set of all objects executed in the i th invocation of loop Lx
In the multiple invocation case, at the end of execution of current object Om for the current invocation i of loop Lx, the error prediction algorithm accepts as input the time series
{Loop_Response_Time_Measured (Ln, Om, i−k),
Loop_Response_Time_Measured (Lx, Om, i−k−1), . . . ,
Loop_Response_Time_Measured (Lx, Om, I)}
where k is the last set of loop invocations of object Om used by the error prediction algorithm
The AMR_Learning_Controller uses the dead time moving average ladder algorithm of this invention as specified in procedure 10. This algorithm enables the estimation of system model order and it's associated dead time parameters for non-linear systems with time varying properties. This means that the system delay can shift as a function of the system operating level. As shown in procedure 10, the powerful orthogonalization properties of the dead time moving average ladder algorithm enable the estimation of the probability limits associated with different prediction distances as well as the residual energy of the prediction error at different system orders. Under special conditions, shown in procedure 10, the dead time moving average ladder algorithm is reduced to the prewhitening ladder algorithm used in the seismic and speech recognition industries (Makhoul 1978, Riley 1972). Fractal representations of procedure 10 algorithms are shown in FIGS. 128 to 132.
AMR Performance Controller: as shown in FIG. 133, this object, uses the ALI_Nets_Temporal_State data structure to generate Configuration_Control_Requests and Scheduling_Control_Requests required to adapt system behavior to meet desired performance requirements. To perform this function the AMR performance controller object invokes the AMR Fuzzy Control Engine as shown in FIG. 134. This engine is aggregated using the following component objects as shown in FIG. 135:
Update membership Functions object which enables the specification, editing, normalization and storage of the member functions of each linguistic variable in the ALI_Nets_Temporal_State data structure. For each variable the seven fuzzy labels EXCELLENT, V. GOOD, GOOD, OK, BAD, V. BAD, TERRIBLE are provided as shown in FIG. 136. Shape, overlap, and number of membership functions can be overridden.
Fuzzifier object which uses the set of ALI_Net Member Functions to compute the degree of membership of each ALI_Nets_Temporal_State crisp value referenced in the antecedent propositions of the ALI_Net rules specified in FIGS. (137-144).
The ALI_Net_Correlator_Aggregator object which maps the fuzzy logic operations specified in the input fuzzy propositions of the ALI_Net performance control rules into output fuzzy propositions that are processed by the Defuzzifier object. The default set of the ALI_Net performance control rules are shown in FIGS. (137-144). This set is edited using information provided by the AMR overload monitor and the AMR learning controller. As selected by the system configurator, the ALI_Correlator_aggregator object uses:
Standard correlation minimum techniques to truncate the consequent fuzzy set, SCL and CCL, at the limit of the premise's truth value of the specified error sets; or the standard Correlation Product techniques to scale the consequent fuzzy set, SCL and CCL, by multiplying each truth membership by the premise truth.
Standard minimum/maximum aggregation techniques to compute the maximum of the consequent fuzzy set and the solution fuzzy set at each point along their mutual membership function. This is followed by aggregating the set of consequent fuzzy sets using the fuzzy union operation; or the standard Additive Aggregation techniques to add the correlated consequent fuzzy set to the contents of the solution variable's output fuzzy region.
Defuzzifier object, which uses the aggregated result of output fuzzy propositions to compute the crisp value of the scheduling priority request conveyed to a specified resource's scheduler object or the crisp value of the configuration load shedding request conveyed to the system configuration control processes.
AMR Configuration Controller: This object disables the execution of nonessential, essential, and critical ALI_Net loops, in this order. Loops to be disabled are those identified in received Configuration_Control_Requests from the AMR Performance Controller. Duration of the disable period is determined by the duration time of the overload or malfunction system conditions which gave rise to conditions detected or predicted by the AMR performance controller. Enabling and disabling commands are carried out by invoking the AMR_Reliable_Configuration_Controller of different concurrent processes.
Procedure 6: Control Oriented Specification of Business Management Activities of a Real System
Failure to adapt products and services, which satisfy rapidly changing customer needs, are attributed primarily to management failure to:
Clearly delineate customer needs and how these needs are met by all business functions at all levels of the organization's work force.
Form business teams that can understand market trends and dynamics, target their products at specific audience, and adapt offered products to changing requirements of customers.
Integrate the customer into the design process to guarantee a product that is tailored not only to the customer's needs and desires but also to the customer's strategies and future goals
Create new products quickly by doing development, manufacturing, and delivering customer satisfaction “right the first time”.
Incorporate provisions for quantifying, measuring and evaluating the value of each product, service or business function.
Reduce all costs of production by enhancing labor productivity; reducing errors, defects, and waste; improving responsiveness and cycle time performance; improving productivity and effectiveness in the use of resources; reducing idle time; and speeding the flow of organized information.
Incorporate provisions for the monitoring and control of different interactions between product development and operational business functions. These interactions, individually and collectively, determine product quality requirements, and its development cost as well as the time and effort required to service customers. Without this analysis, all predictions of business value and its future viability are suspect.
Facilitate the free, but organized, flow of information between development functions responsible for the creation of new products and services, and operational business functions responsible for the day-to-day operation of business.
measure current business processes, predict the impact of business re-engineering changes on product quality and financial results, plan incremental implementation of changes, re measure the designed process against the original goals, evaluate effectiveness of changes and implement the necessary adjustments.
To resolve the above difficulties, the following procedure is used to plan, analyze and manage business operations:
First, the internal structure of an organization structure is specified using two major sets of workflow ALI_Nets as shown in FIG. 145. The purpose of the first set of ALI_Nets, called Business Planning ALI_Nets, is to integrate the customer into the design process of products and services. Product planning ALI_Nets involve three sets of functions: product positioning, market positioning, and corporate positioning. Design of these functions should be carried out using the Relationship Marketing approach advanced by Regis McKenna where:
Product positioning functions determine how the company wants its product to fit into the competitive market
Market positioning functions determine early customer advocates, reseller networks, distributors, third party suppliers, and journalists who control the flow of information and opinion.
Corporate positioning functions validate the company market positioning and its product positioning. It is based on many factors, including corporate history, management strengths, and the selection of product mix. Usually product mix should include silver bullet products, required for future technological survival, and “plain vanilla” products, required for current financial success.
Second, the business planning ALI_Nets should be supported by the second set of ALI_Nets, called AMR Product Development and Operation ALI_Nets. These nets are composed using the following four sets of loops: architecture specification and analysis ALI_Nets; “product/service” design and analysis ALI_Nets; product manufacturing and physical integration ALI_Nets; and product/service tailoring ALI_Nets. As shown in FIGS. 146 and 147, a value cost trade-off analysis is embedded in the very internal operation of each product development loop. This analysis ensures that product development activities are formulated, elaborated, connected, and synchronized with the product planning loops as shown in FIG. 147. In this figure:
The outermost loop architecture specification functions are used to generate alternative operational requirement architecture models for a proposed product concept. These models are used to estimate the technical feasibility, cost, and business value of each operational architecture model as shown in the next step of this procedure. Results of the value cost analysis are used to select the set of one or more operational architecture models to be further investigated.
The middle loop product design functions use the selected operational architecture models to generate detailed integrated design control architecture models. These models are used to estimate the technical feasibility, cost and business value of each system design architecture model as shown in next step of this procedure. Results of the value cost analysis are used to select the set of one or more design control architecture models to be further investigated.
The inner loop product manufacturing functions use the selected design control architecture model to generate integrated implementation architecture models. These models are used to: 1) estimate the technical feasibility, cost and business value of each system implementation option as shown in next step of this procedure; 2) automate the manufacturing of products using design automation tools.
As shown in procedure 5.2, each of the above architecture models is specified by a set of ALI_Net loops such that each ALI_Net graph:
Specifies the set of end-to-end activities that create a valuable result for a customer (end user)
Specifies the business importance of system activities used to provide customers with the required service or product. Business importance is specified using value metrics agreed to by end users and system buyers. Examples of these metrics are shown in FIG. 153. Value metrics are used to resolve design trade off decisions. To achieve adaptive system goals, value metrics are used by the AMR system schedulers to manage the allocation of system resources to loop functions.
Provides system professionals with an invariant mechanism, across different phases of the system life cycle, for representing how system functions are glued to provide required end user functions. This enables the specification, design, implementation, tracking, comprehension, and documentation of the meaning of different levels of inter-connections required to deliver end user function. Levels of interconnections include those between users and external system objects, between concurrent system objects, or between methods of concurrent objects.
Third, as shown in FIG. 148, value cost analysis is carried out using the AMR Sensitivity Analysis tool. This tool is used to compute the operational performance of alternate architecture models. Using the AMR Sensitivity Analysis tool, enable the evaluation of the impact of changes in the system design structure parameters, or available resources, on the system performance metrics. Examples of system performance metrics are response time, throughput, resource utilization, and resource queue levels. Design parameter changes include or its workload characteristics:
Type of messages communicated between system objects, the execution logic of each object and type of synchronization mechanism used to synchronize the sharing of resources used by system objects.
Values of system design parameters for each architecture model under study. These parameters include invocation frequency and workload characteristics of ALI_Net loops and their priorities; processing budgets of object functions; resource size and their allocation strategy to system objects, and processors' ratings.
Scenario generators describing the system environment interactions and inputs workload characteristics.
As shown in FIG. 148, the AMR Sensitivity Analysis tools retrieve from the AMR Knowledge Manager the set of architecture model alternative and their associated AMR_Loop_Process data structures. Each alternative is defined as a performance analysis experiment analyzed by the AMR Parallel Simulation Engine. As shown in FIG. 149, this engine is composed using two major objects, the Multi_Experiment Multi_Node Process Interpreter and the Multi_Experiment Multi_Node Kernel Interpreter.
Fourth, sensitivity analysis results for each ALI_Net of each product design alternative are displayed using ALI_Net Business Tracking graphs shown in FIG. 153. These graphs provide a comprehensive summary of the values of the set of metrics used to measure the operational effectiveness and value of the system design.
Fifth, use the ALI_Net business tracking graphs and their associated Object/loop state graphs to identify bottlenecks of current operations or proposed system designs and resolve design trade off decisions.
Sixth, generate incremental business development plans of proposed system development activities using ALI_Net Project Schedule graphs and their associated Work Break-down Structure graphs as shown in FIGS. 150, 151 and 152. The spiral, incremental, business development plan is constructed using the following rules:
All ALI_Nets can be built concurrently since no coupling between various ALI_Nets exist.
Each ALI_Net has an operational integrity of its own. Hence it delivers to the end user a useful function without compromising the long-term integrity of the system architecture when subsequent builds are delivered.
The Object_Loop precedence graph, of each ALI_Net, specifies coupling between system components and the order of integration of these components to create each Object_Loop and the set of coupled Object_Loops composing the designated ALI_Net. For the automated segments of the real system this integration may be carried out off-line by system developers or dynamically by the AMR run time systems.
ALI_Net graphs are used to automate the generation of system integration and system acceptance tests. Each graph provides an operational definition of how system components should be assembled to meet different end user functional performance requirements.
Seventh, generate Integrated Business Dynamics and Business Control graphs. As shown in FIGS. 152 and 153, these graphs provide a seamless integration of information provided by the ALI_Net business tracking graphs of FIG. 85, and the ALI_Net project schedule graphs. As shown in FIG. 152, the geometric regions can be curved and stretched to represent their time duration, their resource consumption, and their added value metrics. These metrics are displayed in FIG. 152 by unfolding the ALI_Net Business Tracking Graph shown in FIGS. 153. Integrated business dynamics and business control graphs provide business executives with a comprehensive view of business performance, its operational value, its financial value measurement and how these measurements stack against the original goals. This information is used to make the necessary adjustments and upgrade of current business operations, and how these operations can be evolved to incorporate new products.
Procedure 7: Specification of Capabilities of the AMR Tools
In this procedure a user interface of the capabilities of AMR tools is presented. These tools enable the specification, analysis, synthesis, design automation, and sustainment of systems created using M computational models. FIG. 154 provides an overview of the pull-down menus supported by the following set of AMR tools:
Architecture Specification tools as shown in procedure 7.1
Architecture View tools as shown in procedure 7.2
Architecture Analysis tools as shown in procedure 7.3
Real System Planning tools as shown in procedure 7.4
Real System Control tools as shown in procedure 7.5
Project Management tools as shown in procedure 7.6
User Interface of the AMR tools utilize a mixed style of visual and text system specifications. The text specification is primarily used to specify the internal design of visually atomic objects. The visual specification makes extensive use of the M language of this invention to specify and enact the configuration of visually atomic objects into adaptive computer based systems. Although the specific user interface description provided in this procedure contains many specifies, these should not be construed as limiting the scope of the invention but as merely providing illustrations of some of the embodiments of this invention.
Procedure 7.1: Architecture Specification Tools
The following set of menus and dialogue boxes are provided to specify the architecture of real systems:
The “Architecture Categories Rules” dialogue box shown in FIG. 155, which provides users the capability to:
Specify a new architecture category, attributes of the named category and their values.
Display and edit an architecture category, its associated list of instances, allowed list of Object/Resource Categories used by the selected architecture instance, list of allowed Object/Resource Classes of the selected Object Category, and list of allowed Model_Types used to specify the selected architecture instance.
The “Category Specification Rules” dialogue box shown in FIG. 156, which provides users the capability to:
Specify categories of entities referenced by the system specifications.
Default category names supported by procedure 7 tools are:
Model category with default values {Entity_Relationship, State_Transition, Data_Flow, Colored_Petri_Net, Object_Relationship, Loop_Relationship}.
Loop_Relationship category with default values {Processing, Control, Diagnostics}.
Loop_Aggregation category with default values {Object, ALI_Net}.
Object category with default values {Software, Hardware, Infotronic, Netronic, Mechatronic, Notronic}.
Resource category with default values {Human, Physical, Material, Information}.
Signal category with default values {Analogue, Digital}.
Edit above default category names and their values.
The “Model Specification” menu shown in FIG. 157. This menu provides the following six dialogue boxes:
The “Project Region” dialogue box shown in FIG. 157, which provides users the capability to:
Create a project. Project name is used to label the geometric region allocated to the project.
Specify names of project root regions. A region is designated a “Root Region” if it is not contained within any other region of the same type. Four region types are identified: system, external systems, storage resource and pipe.
Display, edit and assign a palette specifying the generalized graphic icons of each entry in the list of projects, their associated list of root external system objects, root system objects, and root resources as shown in FIG. 158.
Specify and edit categories of Object_Loop components of an ALI_Net and their model category as shown in FIGS. (159 and 160). A list of ALI_Net classes and their instances for each selected model category is displayed as shown in FIG. 160.
The “Object Region” dialogue box shown in FIG. 161, which provides users the capability to:
Create an object class, an object instance, its attributes, and their values. Object name is used to label the geometric region allocated to the object If the object name was previously specified, then it will be automatically displayed in the Object region as shown in FIG. 161.
Specify input/output pipes names. These regions are specified using FIG. 167 dialogue box.
Specify Object name, its category, class, attributes and methods as shown in FIG. 162.
Display the system object inheritance tree. Two types of displays can be invoked by the “Class Inheritance Graph Display Option” button: a traditional class inheritance tree display or a geometric Class inheritance graph display as shown in FIG. 162. The latter display provides a geometric representation of different object classes of a given object inheritance tree using a fractal pattern of multilevel regions where the lowest region level represents the root of the inheritance tree.
View all system object classes of the selected category (object class window), attributes of each class (object attributes window) and its methods (Object methods window). These windows may display all object classes of the given project such that all list entries associated with the object region invoking the dialogue box are tagged when the dialogue box is opened. Or displayed lists may be limited to relevant information of the object region invoking the dialogue box as shown in FIG. 162.
Specify attributes and methods of object classes. For visually atomic objects create or edit the code of object classes, methods and their attributes using the textual natural or programming language editor window as shown in FIG. 162.
Display, edit, and assign a generalized graphic icon to each entry in the list of object classes and their methods as shown in FIG. 163.
Generate a lower level display of the component objects of a container object Δ by double clicking any way within the selected region as specified by procedure 2 rules.
The “Storage Region” dialogue box shown in FIG. 164, which provides users the capability to:
Create a storage type, storage instance, its attributes, and their values. Storage name is used to label the geometric region allocated to the storage resource If the storage resource name was previously specified, then it will be automatically displayed in the resource region allocated to the resource as shown in FIG. 164.
View system storage classes of the selected category, their attribute values and name of object managers of each resource class. These windows may display all storage resource classes of the given project such that all list entries associated with the storage resource region invoking the dialogue box are tagged when the dialogue box is opened. Or displayed lists may be limited to relevant information of the storage resource region invoking the dialogue box. If a resource manager is not specified then it is assumed that the named resource is directly manipulated and managed by the higher level container (parent) object. In this case methods of the parent object (the resource manager) are used to access the named resource as shown in FIG. 165.
Display, edit, and assign a generalized graphic icon to each entry in the list of storage resource classes, their attributes and their resource managers as shown in FIG. 166.
Create, edit, or save displayed resource types. Resource attributes can be defined using abstract data types such as a constant, a decision or a routing table, an attribute table, a logical relationship, a relational relationship, or a probabilistic relationship. These modifications can be saved in project libraries specified using the dialogue box of FIG. 155.
Designate resources that are persistently stored on secondary memory.
Specify the allocation of resources to different object loops as specified in the AMR configuration controller dialogue box, FIG. 191. This dialogue box enables viewing the list of loop names, and their types, associated with the named resource region.
Generate a lower level display of the component resources of a storage resource region ∇ by double clicking any way within the selected region as specified by procedure 2 rules.
The “Pipe Region” dialogue box shown in FIG. 167, which provides users the capability to:
Create a pipe type, pipe instance, its attributes, and their values. Pipe name is used to label the geometric region allocated to the pipe resource. If the pipe resource name was previously specified, then it will be automatically displayed in the pipe region allocated to the resource as shown in FIG. 168.
Specify message classes, their attributes and values handled by the pipe resource and their encapsulating communication manager. Message classes define the external interface of objects connected to the named pipe class. Message class definition include:
Application data entity subreference specifying message name and type.
Object subreference specifying names of message generator, senders and receivers objects.
Predicate subreference specifying one or more sets of the named message data entities.
Time subreference specifying message generation, send, and receive times.
Select and edit message classes and communication managers using lists of message classes and communication managers stored in the project data base.
Allocate selected message types to loops and message coordination by invoking the Loop Type Specification dialogue box as shown in FIGS. (168 and 169).
View pipe classes of the selected category, their attribute values and their communication managers as shown in FIG. 168.
Display, edit and assign a generalized graphic icon to each entry in the list of pipe classes, their attributes, and their communication managers. see FIG. 169.
Generate a lower level display of the component resources of a pipe resource region ∇ by double clicking any way within the selected region as specified by procedure 2 rules.
The “Loop Region” dialogue Box shown in FIG. 170, which, for a selected set of one or more edges, provides users the capability to:
Create a loop type, loop instance, its attributes, attribute values, and terminal loop methods. Loop name is used to label the geometric region allocated to the loop. If the loop resource name was previously specified, then it will be automatically displayed in the loop region allocated to the resource as shown in FIG. 170.
Designate the loop as a root loop. A loop is designated a “Root loop” if all of its edges are not a subset of the loop edges of another loop.
Display the inheritance tree of system loops.
View all system loop classes of the selected category, attributes of each class, their methods and the interface definition language specification of each component object performing loop functions. These windows may display all loop classes of the given project such that all list entries associated with the set of loops invoking the dialogue box are tagged when the dialogue box is opened. Or displayed lists may be limited to relevant information of the set of loops invoking the dialogue box. As shown in procedure 5.3.3.1, loop attributes include loop priority to specify the business criticality of a selected loop and the desired and actual performance parameters of the selected loop such as the loop execution frequency, loop response time, and loop throughput These parameters are used to generate display diagrams to visualize system dynamic evolution under different operating conditions as shown in FIG. 36. As shown in procedure 5.3 these parameters are also used by loop enactment tools to control system behavior to meet user specified loop performance parameters.
Specify the loop branching conditions executed by each component object of the selected loop. The loop branching conditions dialogue box, enables the display of loop lists for each object selected from the Loop Object window, resources consumed, generated, or shared by the selected object to perform loop functions and the attributes of each of these resources. Entries from these lists are selected and used to specify the logical expressions of both input, output conditions and the annotation of loop edges as shown in FIGS. (74-77.
Specify message coordination executed for each branch of the selected loop. The message coordination dialogue box of FIG. 171, enables:
Selection of message synchronization options such as synchronous or asynchronous.
Designation of a named event flag to indicate send or receive events of the named messages by the sender and receiver objects.
Attach a no wait or a specified wait condition to the loop branch communication request. If the requested message communication is not completed within the specified wait time, then the named event flag will be set.
Display, edit and assign a generalized graphic icon to each entry in the list of ALI_Net loops, Object loops, their methods and arguments as shown in FIG. 172.
Generate a lower level display of the component of a compound loop region Δ by double clicking any way within the selected region as specified by procedure 2 rules.
The “Model Manipulation” menu shown in FIG. 173. This menu enables tool functions providing Aggregate, De-aggregate, Layer, Fold, and Unfold operations on the selected set of geometric regions using drag and drop operations. These operations are carried out on the selected geometric regions using rules specified in procedures 2, 3, 4 and 5 and their supporting figures.
The “Architecture Constraints” menu which consists of the Object Relationship Constraint menu and the Loop Relationship Constraint menu as shown in FIG. 174 where:
The Object Relationship Constraint menu provides the following two dialogue boxes:
The “Containment Relationship Constraint menu” dialogue box, which provides users the capability to:
Configure a container object using a set of one or more component objects as shown in FIG. 174. This operation can be equally achieved by drag and drop operations on the geometric regions of the container and component objects using rules specified in procedures 1-6.
Display a list of message interface and storage resource classes encapsulated by the selected container or component objects as shown in FIG. 174.
The “Association Relationship Constraint menu” dialogue box, which for a selected one or more object regions provides users the capability to:
Display the association relationships between the selected set of objects using the coloring scheme shown in FIG. 175 or an equivalent form of relationship identification such as the associated object name.
Specify the Cardinality Constraints and the min. and max. parameters of the participation and the Co_Occurrence constraints for each selected association relationship using the dialogue box of FIG. 176.
The “Loop Relationship Constraint” menu dialogue box shown in FIG. 177, which provides users the capability to:
Display a list of ALI_Net classes and their instances; their component Object_loops and their instances.
Display a list of coupled ALI_Nets for a selected ALI_Net class or one of its instances.
Display a list of coupled object_loops for a selected object_loop class or one of its instances.
Procedure 7.2: Architecture Viewing Tools
The following set of dialogue boxes are provided to specify display views of a real system:
The “Architecture View Type” dialogue box, shown in FIG. 178, which provides users the capability to:
Specify the display type of the architecture views of a selected model type of a selected architecture category. This view may be restricted to a selected set of ALI_Net classes, and their component object_loops, executing on a selected set of nodes and processors.
Define the architecture view display type by selecting projection type and enabling/disabling the semantics and geometric icons of components referenced by the selected architecture.
The “Region View Type” dialogue box, shown in FIG. 179, which provides users the capability to:
Define the region display type by enabling/disabling the semantics and geometric icons of the selected region categories.
Define region annotation as shown in the annotation options dialogue box for the selected region type.
Procedure 7.3: Architecture Analysis Tools
The following set of dialogue boxes are provided to analyze the architecture of a real system:
The “Structural Analysis Reports” dialogue box shown in FIG. 180, which provides users the capability to:
Display a list of undefined initial condition resource regions and list of unreachable state regions for selected instances of a selected ALI_Net class or selected instances of a selected Object_loop class of the selected instances of the selected ALI_Net.
Display a list of boundedness, deadlock, and liveness metrics of the selected set of coupled ALI_Nets and their component object loops.
Display a tool computed fractal dimension of the selected set of coupled ALI_Nets and their component object_loops.
Display a tool computed entropy metric of each object_loop of a selected ALI_Net.
Display a tool computed entropy coupling transmission metric between selected object loops
The “Dynamic Analysis Reports” dialogue box, shown in FIG. 181, which provides users the capability to:
Display a list of desired, actual, and error values of “Loop_Load, Loop_Response_Time & Loop_Service_Time” variables for selected instances of a selected ALI_Net class or the selected instances of a selected Object_loop class of the selected instances of the selected ALI_Net.
Display a list of desired, actual, and error values of “Loop_load & Loop_Service_Time” variables for the selected instances of selected Object_loop class of the selected instances of the selected ALI_Net.
Display a list of service times and utilization levels of methods and resources used to execute the selected ALI_Net loops and their component object_loops.
Procedure 7.4: Real System Planning Tools
The “Real System Planning” dialogue box shown in FIG. 182, enables users to plan the routing and connectivities between real system objects. To support these activities, three dialogue boxes are provided:
The “Specify Geographical Constraints of Infotronic and Organizational Objects” dialogue box shown in FIG. 183, which provides users the capability to:
Display lists of organizational objects, workstations, infotronic objects and geographical map overlays.
Display a three dimensional grid of the selected geographical area as shown in FIG. 183. Each cell in this display represents a geographical region in the Euclidean space of the physical grid and may contain a resource object or a container object.
Drag an entry into the above list and drop it in a cell on the three dimensional display. This action will be used by tool functions to allocate the selected object to the selected region. Lower level state space composition of the selected object will be contained within the Euclidean cell region allocated to the object.
Display the configuration of a node selected from the cellular structure as shown in FIG. 184.
The “Specify Geographical Constraints of Mechatronic Objects” dialogue box shown in FIG. 185, which provides users the capability to:
Display lists of mechatronic objects and geographical map overlays.
Display a three dimensional grid of the selected geographical area as shown in FIG. 185. Each cell in this display represents a geographical region in the Euclidean space of the physical grid and may contain a resource object or a container object as specified in procedure 5.2.
Drag an entry into the infotronic objects list and drop it in a cell on the three dimensional display as either an initial, way or target position. This action will be used by tool functions to allocate the selected object to the selected region. Lower level state space composition of the selected object will be contained within the Euclidean cell region allocated to the object.
Select a set of regions as obstructed by a selected type of physical constraint from the selected constraints category list.
The “Plan Routing and Connectivity of Mechatronic Objects” dialogue box, shown in FIG. 186, which provides users the capability to:
Specify route plan of the selected infotronic object.
Display a tool generated route for the selected infotronic object. This route can be edited by the user.
Procedure 7.5: Real System Control Tools
The following set of menus and dialogue boxes are provided:
The “Information Control” menu. This menu provides the following six dialogue boxes:
The “AMR Supervisory Control” dialogue box shown in FIG. 187, enables users to edit the configuration of the AMR supervisory controllers. To support these activities, six dialogue boxes are provided:
The “AMR Overload Monitor View Controller” dialogue box shown in FIG. 188, which provides users the capability to:
Display lists of ALI_Net loops; object loop components of the selected ALI_Net and their instances; component objects and their methods for selected object loop and their attributes, resources used by the above selected loops and methods; attribute names and their values for the selected resources.
Enable or Disable the monitoring views controller.
Declare a selected loop category as critical, essential or non-essential.
Select the default set of parameters monitored by the monitoring views controller for a selected set of loops. Default set consists of loop load, loop response time, loop service time, method service time, and loop accuracy.
Select a subset of the default set of performance parameters monitored by the monitoring views controller.
Monitor and persistently store a selected set of resources used by a selected set of one or more loops.
The “AMR Learning Controller” dialogue box shown in FIG. 189, which provides users the capability to:
Display lists of ALI_Net loops; object loop components of the selected ALI_Net and their instances; component objects and their methods for selected object loop and their attributes, resources used by the above selected loops and methods; attribute names and their values for the selected resources.
Enable or Disable the ALI_Net learning controller.
Select the default prediction distance set and maximum prediction distance.
Specify maximum prediction distance and maximum allowable prediction error.
Predict the utilization levels of a selected set of resources.
The “AMR Performance Controller” dialogue box shown in FIG. 190, which provides users the capability to:
Display lists of ALI_Net loops; object loop components of the selected ALI_Net and their instances; component objects and their methods for selected object loop and their attributes, resources used by the above selected loops and methods; attribute names and their values for the selected resources.
Enable or Disable the ALI_Net performance controller.
Declare a selected loop category as critical, essential, or non-essential.
Specify desired load and response time of a selected set of one or more loops.
Specify service time of a selected set of one or more methods.
Select the default set of parameters used by the ALI_Net performance controller for the selected set of loops. Default set consists of temporal data structures, control rules, correlation/aggregation rules, and fuzzy control membership functions.
Control the performance of ALI_Nets referenced by the above selections.
The “AMR Configuration Controller” dialogue box shown in FIG. 191, which provides users the capability to:
Display lists of ALI_Net loops; object loop components of the selected ALI_Net and their instances; component objects and their methods for selected object loop and their attributes, resources used by the above selected loops and methods; attribute names and their values for the selected resources.
Enable or Disable the ALI_Net configuration controller.
Declare a selected loop category as critical, essential, or non-essential.
Select dynamic allocation of resources to selected loop functions implemented by the ALI_Net performance controller.
Bind the selected set of ALI_Net, object loops, and objects to the selected set of physical resources.
The “AMR Security Controller” dialogue box shown in FIG. 192, which provides users the capability to:
Display lists of ALI_Net loops; object loop components of the selected ALI_Net and their instances; component objects and their methods for selected object loop and their attributes, resources used by the above selected loops and methods; attribute names and their values for the selected resources.
Enable or Disable the ALI_Net security controller.
Select security level for the selected set of loops, objects, and/or methods.
Select the use of public session keys for a selected object loop.
Specify authorized users for each security level associated with the selected loops.
Select read/write options protections for the resources associated with the selected set of loops, objects, and/or methods.
Enforce security requirements specified by the above selections.
The “AMR Reliability Controller” dialogue box shown in FIG. 193, which provides users the capability to:
Display lists of ALI_Net loops; object loop components of the selected ALI_Net and their instances; component objects and their methods for selected object loop and their attributes, resources used by the above selected loops and methods; attribute names and their values for the selected resources.
Enable or Disable the ALI_Net reliability controller.
Select communication and or system recovery reliability functions implemented by the ALI_Net controllers.
Select communication semantics as exactly once or at least once to the selected set of loops.
Select resource categories recovered by the ALI_Net reliability controller.
The “Equipment Scheduling” dialogue box shown in FIGS. 194 which provides users the capability to:
Select object loop category as processing, control, or diagnostics.
Display lists of ALI_Net loops and object loop component of the selected ALI_Net.
Display lists of candidate instances of the mechatronic, infotronic, and notronic component objects and their instances.
Define a priority level for each object instance.
Schedule objects referenced by the above selections.
The “Personnel Scheduling” dialogue box shown in FIGS. 195 which provides users the capability to:
Select object loop category as processing, control, or diagnostics.
Display lists of ALI_Net loops and object loop component of the selected ALI_Net.
Display lists of candidate instances of organizational object classes.
Define a priority level for each object instance.
The “ALI_Net Scheduling” dialogue box, shown in FIG. 196, which provides users the capability to:
Select object loop category as processing, control, or diagnostics.
Display lists of ALI_Net loops and object loop components of the selected ALI_Net.
Select value function associated with the selected ALI_Net and/or Object_Loop. This function is used by the ALI_Net scheduler.
Define new value functions.
Define trigger timer of the selected loops.
The “Real System Identification” dialogue box, shown in FIG. 197, which provides users the capability to extract the dynamic behavior model for the selected set of ALI_Nets, Object_Loops, and their methods residing on a selected set of nodes and processors. This is carried out for the selected set of event types associated with the selected ALI_Nets.
Procedure 7.6: Project Management Tools
The “Project Management” dialogue box shown in FIG. 198, provides users the capability to:
Select an architecture model from the list of alternate architecture models stored in the knowledge data base. Each of these models defines the integrated operational/system architecture model of the business operations under study. See procedure 6 for description of method used to generate alternate business architecture models.
Select the set of value functions/metrics used to evaluate the selected architecture model.
Display lists of ALI_Net loops; object loop components of the selected ALI_Net and their instances; component objects and their methods for selected object loop and their attributes, and resources used by the above selected loops.
Select required value/cost project management displays to incorporate break down structure, project schedule, business tracking, and operations dependencies information for the selected architecture specification level. The four level categories, operational architecture, design, manufacturing, and tailoring, are specified as shown in procedure 6.
Select display type as tabular or graphic. Graphic displays are generated for the selected information using displays of the type shown in FIGS. 150-153.
Procedure 8: Architecture of the AMR Tools Kit
Plan projection of the AMR tools kit is shown in FIG. 199. The AMR Common Development Environment (CDE) knowledge controller and the AMR Common Operating Environment (COE) knowledge controller knowledge controllers are used to specify, encapsulate and manage the integrated ALI_Net meta model which captures the static and dynamic object relationships of the enterprise during all phases of the real system life cycle.
Each AMR knowledge controller is created using the concurrent processing control objects set shown in FIG. 123. As shown in FIG. 200, each Reliability Controller is constructed using four set of objects: Data_Integrity_Controller, Transaction_Correctness_Controller, Transaction_Atomicity_Controller, and the AMR_Structural_Integrity_Controller. The latter controller verifies and validates the structural integrity of the evolving enterprise wide operational/system architectures and its compliance with declared constraints and rules provided in this invention including object attribute and association constraints as shown in FIGS. (42 and 43); and structural constraints as shown in FIGS. (68, 92, 112 and 113) and their associated construction procedures. For each enterprise these rules and constraints are captured by a layered set of distributed M data model schemas as shown in FIGS. 201 to 209 where:
Each of the M(k) schemas, where k is BM, DM, ASA, SP, ASC, SI and OS, provides data base administrators with defined views used to regulate their respective tools access to shared and protected data.
A semantic filter defined between each M(k) schema and its respective CDE or COE M metaschema as shown in the two isomorphic plan projections of FIGS. 202 and 203.
Each of the M(k) schemas is specified by a set of subschemas. Each M subschema specifies the M schema at a specified level of abstraction. The containment relationships between the different levels is shown in FIGS. 204 and 205.
Each of the M subschema is defined using the set of a data definition dictionary, meta knowledge rules and ALI_Nets as shown in FIGS. 205 and 206. This set, in accordance with procedure 5.2.2 rules, is defined at the given level of system abstraction over the shared set of active and passive object entities. Meta knowledge rules may restrict the allocation of the set of active/passive objects to a certain set of one or more architecture levels.
The above set of M schemas are implemented using a set of distributed cooperating servers residing on each node of different sites of the distributed development systems. Two basic types of configurations can be realized. The first fully distributed configuration has no semantic filters as shown in FIGS. 207 and 208. In this configuration each of the M schemas supporting BM, DM, ASA, SP, ASC, SI and OS loops categories is embedded within the boundary of tools supporting the specification, analysis, synthesis, design automation and sustainment of these loops. This implies a homogeneous design of the AMR tools kit where the underlying design of each tool is carried out using an M schema and its underlying M model design concepts. The second partially distributed configuration is shown in FIG. 209. In this configuration the tool kit is created using a heterogeneous set of tools whose interoperability is mediated using a set of semantic filters as shown in FIG. 213. These filters mediate the underlying semantics of each tool with the integrated semantics of the CDE M schema and COE M schema
The CDE knowledge controller is implemented by a set of distributed cooperating servers residing on each node of different sites of the distributed operational systems. These servers provide the product development/acquisition loop tool set with the following set of service capabilities as shown in FIG. 210:
Declare the set of rules used to specify the enterprise integrated operational/system architecture using procedure 7 dialogue boxes. These rules enable project/enterprise architects to:
Define the number and user defined names of the set of architecture “integration level” models. As shown in FIG. 204, these models are used to specify business operations at different levels of abstraction from the specification of operational missions down to the blue print specification of the real system implementation and fabrication architectures. Examples of architecture “integration level” models are multi-site operational requirement architecture, multi-site functional architecture, multi-node network architecture, multi-processor hardware architecture, and multi-process software architecture.
Define the set of static and dynamic model types used to specify system architecture at each architecture integration level. As shown in FIG. 212, examples of UML static model types are classification, association, and aggregation, object relationship models. Examples of UML dynamic model types are sequence, collaboration, statechart, activity, and implementation diagrams.
Specify the integration level of each model type. Integration levels provide an ordered top-down hierarchical containment relationship between a given set of architecture models.
Associate with each architecture level the set of admissible objects and resource types. Each of these items is an element of the real system Entity Relationship or Object Relationship models. Objects and resource types of each level may be hierarchically ordered.
Visually Create, store, retrieve and edit static and dynamic model types.
Visually Create, store, retrieve and edit instances, i.e. occurrences, of static and dynamic model types.
Automatically integrate model types at each level to create single level and multi level integrated architecture models. Integration rules are dependent on the model type paradigm used such as UML, IDEF, etc. For the UML case, the formal geometric language of this invention enables: 1) integration of different UML static and dynamic model types into a single level integrated architecture, and 2) integration of different levels of system architectures into one unified AMR architecture.
Automatically generate model types tailored to the semantic requirements of a specific end user type or a specific tool type. Examples of user types are project managers, system architects, object developers, and system operators. Examples of tool types are project management, cost analysis, requirements analysis, architecture specification, capacity planning, design simulation, reverse engineering, code generation, and test automation.
Check, report, and enforce compliance of the architecture integration models and their component models, to project and/or enterprise wide architecture rules.
The AMR COE knowledge controller, is implemented by a set of distributed cooperating servers residing on each node of different sites of the distributed operational systems. These servers provide business operations with the following set of service capabilities as shown in FIG. 211:
Configure the real system integrated architecture at each node using architecture specification, planning, and scheduling procedures of this invention.
Use existing system loading and installation tools to load and install the configured architecture and its underlying AMR data structures at each node (site).
Support the run time operations of the AMR planning, scheduling, and system control as shown in procedure 5.3 and FIG. 100.
Two major types of AMR tool kits are specified. Whereas the first type of kit is created using a homogeneous set of tools, the second type of kit is created using a heterogeneous set of tools. By a homogeneous set of tools we mean that each tool is designed to implement the underlying semantics of the ALI_Nets as specified by the design concepts, data structures, and procedures of this invention. By a heterogeneous set of tools, we mean that each tool was not designed to implement the M model design concepts but nevertheless can provide some required system specification, analysis or implementation functions. As shown in FIG. 213, the second type of tools kit consists of a heterogeneous set of tools. Each of these tools can be an off-the-shelf commercial tool which can provide some of the functions required to implement the integrated design concepts, data structures, and procedures of this invention. Interoperability of these tools requires the specification of a semantic filter, i.e. information schema, for each tool.
Procedure 9: AMR Architecture Complexity Metrics
In procedures 4 and 5 it is shown that the integrated architecture of a real system is efficiently specified by the geometric system evolution map illustrated in FIGS. 35, 36, and 37. These figures describe the set of evolutionary processes used to specify the static and dynamic binding of system component objects into adaptive operational system architectures. The quality of an architecture is evaluated using two types of architecture complexity metrics. The first type of metrics, calculated using procedure 9.1, enables the evaluation of the packing efficiency of the system structure. The second type of metrics, calculated using procedure 9.2, enables the evaluation of system order, its structural partitioning and aggregation. Both types of metrics are applicable to a broad area of application systems and are independent of the implementation medium of the specified architecture. The implementation medium may be software, computer hardware, firmware, or metal.
Procedure 9.1: Fractal Dimension Metrics of System Complexity
An integrated architecture of real systems has a self-similar or a self-affine fractal design structure as shown in FIGS. 35, 36, 51, 52, 62, 94, and 97. This structure is used to specify: 1) the static and dynamic binding, i.e. integration, of system components to form Infotronic, Mechatronic and Netronic objects, and 2) the dynamic binding of these objects to create adaptive operational system architectures. A useful description of a given system architecture is the fractal dimension of the system's spatial structure. As introduced by Mandelbort, the key idea behind fractal dimension is that a rugged object can be described by extending the classical concept of dimensional analysis to include a fractional number that describes the ruggedness of the object in the space spanned by the whole number dimensions encompassing its fractional magnitude. This invention, provides a novel application of Mandelbort's ideas to evaluate the spatial structure of software intensive system architectures. Specifically this invention:
Recognizes that the dimensionality of a software intensive system depends on the operations performed on it either mentally during the concept exploration and analysis phases or physically during the development and sustainment phases of the system life cycle. This means that system geometric regions which may be smooth at the system functional architecture level can appear to be rugged, i.e. fractured, at the system implementation architecture level. This implies that the fractal dimension of the architecture of a real system is always associated with its specified resolution at various architecture levels.
Provides a set of architecture complexity metrics. These metrics are used to evaluate the fractal design structure of an evolving system architecture at the different levels of resolution. Each level is used to support specified system operations during a specified phase of the system life cycle.
Complexity metrics of system architectures are calculated using the following procedure where each category of the system architecture is specified at a given phase of the system life cycle:
First, compute:
SON(Ln)=number of self-affine component objects specified at the nth level of the fractal structure of the static architecture.
SOS(Ln)=scale factor used to generate SON (Ln) components
Set Fractal_Dimension_Static_Structure (Ln)=log(SON(Ln))/log(1/SOS(Ln))
Second, compute:
DON(Ln)=number of self-affine ALI_Nets specified at the nth level of the fractal structure of the dynamic architecture.
DOS(Ln)=scale factor used to generate DON(Ln) components
Set Fractal_Dimension_Dynamic_Structure (Ln)=
log(DON(Ln))/log(1/DOS(Ln))
Third, plot:
log(SON(Ln)) vs log(1/SOS(Ln))
Fourth, generate:
The best fit straight line for the log(SON(Ln)) vs log(1/SOS(Ln)) plot
And set:
Average_Fractal_Dimension_Static_Structure Slope of the generated best fit line.
Fifth, plot:
log(DON(Ln)) vs log(1/DOS(Ln))
Sixth, generate:
The best fit straight line for the log(DON(Ln)) vs log(1/DOS(Ln)) plot.
And set:
Average Fractal_Dimension_Dynamic_Structure=Slope of the generated best fit line
In the above calculations it is assumed that 1) the mass of each component object is empirically specified as the number of lines of code used to specify the visually atomic component object at the specified resolution, and 2) all component objects have a unit mass. This latter assumption can be relaxed by modifying the above procedure where SON(Ln) and DON(Ln) are specified as follows:
SON(Ln)=SOM(Ln)=Average mass of the component objects specified at the nth layer of the fractal structure of the real system static object model.
SOS(Ln)=SOL(Ln)=Average length of geometric region of the component objects used to calculate SOM(Ln)
DON(Ln)=DOM(Ln)=Average mass of the concurrent object components of the ALI_Net specified at the nth level of the fractal structure of the dynamic architecture.
DOS(Ln)=DOS(Ln)=Average length of geometric region of the concurrent objects used to calculate DOM(Ln)
Procedure 9.2: Entropy Metrics of Systems Complexity
As shown in procedure 4, the spatial and time evolution of the system design structure is specified using a geometric system iterative map as shown in FIGS. 35 and 36. This map specifies a time indexed sequence of instances of the system architecture model. Each element in this sequence is a snapshot of the system state space structure at a specified time instant and the state of the system at each time instants is specified by the values of an ordered set of variables xj which reside in various passive regions of the M model of a real system.
In this invention an architecture complexity is measured using entropy metrics of the set of ALI_Nets used to compose a given architecture. Justifications for selecting entropy as an architecture metric are:
Each ALI_Net specifies an architecture partition which can be independently configured, tested, controlled, maintained and modified.
Each ALI_Net defines the set of relations between system elements that operate as a constraint on the behavior of the system variables.
Since the absence of relations or constraints is randomness, it is reasonable to use entropy as a measure of system order. By that we mean a measure of the degree of coupling and interaction between the component objects of each ALI_Net. This measure is calculated using the following procedure:
Given an architecture model of a real system S specified by the set of ALI_Nets where,
S=[AL(1), AL(2), . . . , AL(m), . . . , AL(n)]
And each ALI_Net, AL(m), is specified by the aggregated set of object_loops
AL(m)=[OL(m, 1), OL(m, 2), . . . , OL(m, j), . . . , OL(m, km)]
And the state of each object_loop, OL(m, j), is defined by the state vector,
OL(m,j)=[x(j, 1), x(j, 2), . . . , x(j, nj)].
First, compute the entropy H[OL(m, j)] of each object_loop, OL(m, j), where 
where ni=number of occurrences of the ith possible value of OL(m, j)
Second, compute the coupling C(Li, Lj) between each pair of system loops object_loop, OL(m, i), and object_loop, OL(m, j), provided by the transmission T(Si:Sj).
where
H[(OL(m, i), OL(m, j)]=Entropy of the union of the two loops OL(m, i) and OL(m, j).
From the above equation it follows that:
H[(OL(m, i), OL(m, j)]=0 iff OL(m, i) and OL(m, j) are statistically independent and,
H[(OL(m, i), OL(m, j)]=maximum if one loop is dependent upon the other loop.
Procedure 10: Error Prediction and Model Estimation Algorithms
Error Prediction and Model Estimation is carried out as follows:
Given an unknown single input-single output system and a pair of measurements (ut, yt), estimation of system parameters can be carried out in terms of:
1. The impulse response (moving average, all zeros) model
2. The Auto regressive-Moving average model 
where A, B, and G are polynomials in z−1 whose orders are na, nb and ng respectively.
From equation (2):
where Ψyu, Φuu and G are the cross covariance and auto covariance functions.
Equation (3) does not, in general, provide efficient estimates for and requires knowledge of j beyond which gj is effectively zero. If variation in input is large compared to that due to noise and/or a large volume of data is available, then the impulse response can be directly estimated from the orthogonal set of equations defining the cross correlation function between the prewhitened input ut 1 and the corresponding transformed output yt 1, that is:
where
u t 1 =W(z −1)X −1(z −1)u t (5)
By equating the coefficients of z−1 of equations (1) and (2), we have: 
Knowledge of the estimated cross correlation function ψu t 1 y t 1 and its standard error can be used for iteratively estimating k, A and B polynomials (Box 1976, Godfrey 1969, Clarke 1969)
Dead time estimation by this method depends on the inspection of the terms where in the presence of noise it may be hard to discriminate between zero and non-zero terms. In this invention, a ladder structure is developed which computes the optimum impulse response by minimizing the total square error. 
where 
By setting 
Computation of the expectation functions E of equation (8) depends on the statistical characteristics of the signal where it can be shown that if ut is stationary, then E(ut−jut−i) is the auto correlation matrix Φuu(i, j) which is Symmetric Toeplitz. On the other hand, if ut is nonstationary, then the expectation function is the auto covariance matrix Φuu(i, j) which is Symmetric but non-Toeplitz.
Equation (8) can be solved in two stages using Levinson recursion whose derivation is based on the Toeplitz properties of the auto correlation matrix as follows: (Levinson 1947)
First, Compute the auxiliary sequence Cj (m) (where m defines the order of the filter) as follows: 
Second, Compute the impulse response coefficients as follows: 
Third, Estimate the adequacy of the predictor length from: 
A moving average ladder can be built to implement equation (9) to (16) as follows:
Equations (11) and (14) can be rewritten in the form: 
By defining:
P (m+1)=1−C m−1 (m−1) z −1 −C m−2 (m−1) z −2 − . . . −C 0 (m−1) z −m (19)
Therefore, from equations (17) and (18):
and from equations (7) and (26):
Equations (28), (30) and (31) can be represented by the Moving Average ladder shown in FIG. 128. The moving average ladder can be reduced as special cases to implement prediction filters with prediction distance k where from equations (7) and (8) for yt=ut+k. 
By defining:
it follows that:
which results in the general auto regressive prediction ladder shown in FIG. 129.
The prewhitening filters used in the seismic and speech recognition industries (Riley 1972, Makhoul 1975, 1977, 1978, Messershmitt 1980) can be derived from the general prediction ladder for k=1.
If k=1, then from equations (10) to (14):
w m (m) =C 0 (m) for all m (38)
and from equation (33),
and from equations (19), (22) and (39),
The above equations show that for the spiking ladder case, the right-hand side of FIG. 1 is the mirror image of the left-hand side. Furthermore, by defining the two-point vector xt=(ut, yt)T and ft (2)=(ut−C0 (0)ut−1, yy−C0 (0)yt−1)T where C0 (0) estimation is based on ut statistics only, then the whitened input, transformed output pair is defined by xt 1=(ut 1, yt 1) as implied by the ladder shown in FIG. 130.
The residual error energy at different stages of single variable ladders is estimated as follows:
At the (m+1)th stage of the ladder, there are three residual error sequences whose energies are defined by: 
For weakly stationary signals, from equations (19) and (20):
E f (m+2) =E r (m+2) =E (m+2)
From equations (92) and (95), it is shown that:
Therefore, from equations (44) to (46):
where:
Therefore: 
and 
For the general auto regressive ladder, from equations (33), (35), (37) and (94), it follows that: 
Therefore, the goodness of the prediction as a function of the prediction distance k can be computed from equations (51) and (53): 
which is a function of the pivotal elements of the ladder wi (i) and C0 (i) only.
Another measure about the adequacy of the length of the prediction filter which is independent of the energy of the input time series is given by: 
The structural properties of single variable ladders are evaluated as follows:
By defining the polynomial:
then from equations (26) and (31):
where:
V t=(y t ,u t−1 ,u t−2 , . . . , u t−m−1) (59)
It can be shown that minimization of: 
will result in the normal equations: 
and the residual error energy of: 
By augmenting equations (60) and (61), we have: 
The above matrix is symmetric but non-Toeplitz.
From equation (58), we can define the matrix S
which can be expanded as follows: 
Therefore: 
From equations (62) and (64), it can be shown that: 
Therefore, the determinant of SΦvvST is given by: 
Since from equation (63), determinant of S is given by: 
it follows that determinant of Φvv is given by: 
Since 
where λi (m−1) are the eigen values associated with Φvv, and since a positive definite real symmetric matrix has only positive eigen values, it follows from equation (52) and (77) that the positive definite conditions of Φvv is guaranteed if all Ee (i)(0) are positive and monotonically decreasing which implies that the modulus of C0 (i) and wt (i) for all i is less than one and are monotonically decreasing.
Next for the general prediction ladder from equations (34), (35) and (37), it can be shown that the normal equations are: 
with an associated residual error energy of: 
Furthermore:
where Ψu,u t +k is the cross correlation function of the input and desired time functions.
From equations (69) to (71), it follows that: 
where 0k−1 is the null array of dimension k−1 and where ψ(i+1)(j) is the jth lag cross correlation function associated with the ith order filter 
The high order lags of the cross correlation function will disappear when the optimum length of the filter is set equal to the length of the auto correlation vector. Furthermore, from equation (69), the zero lag auto correlation function of the residual error E(i+1)(0) is equal to the zero lag cross correlation function ψ(i+1)(0). In this case, the prediction error filter S(m+1) shortens the input wavelet ut of length k+i to an output wavelet of length k. Because k is user defined, the user has a means for controlling the desired degree of wavelet contraction.(Alam 1977)
By reversing S(m+1), equation (72) can be rewritten in the form: 
From equation (34), we define the matrix S such that:
Equation (73) can be expanded as: 
hence:
Φee=eeT=SuuTST=SΦuuST= 
Since det (SΦuuST)=det (Φuu) det (det(S))2, it follows that if det Φee is negative, then det Φuu is negative. Equation (77) implies that existence of the inverse of S depends only on the zero lag autocorrelation of the error sequence at different filter orders, and it exists if:
1. All zero lag auto correlation functions Ee (i)(0) are positive
2. Ee (i)(0) where i=1, 2, . . . , m; is monotonically decreasing
Since Ee (i)(0) is a function of C0 (j) and wj (j) for j=0, 1, . . . , i−1, it follows from equation (52) that the above conditions are satisfied if |wi (i)|<|C0 (i)|<1 for all i and all elements wi (i) are monotonically decreasing.
Finally, by analyzing the left hand side of the ladder for k=1, from equation (69) and (70): 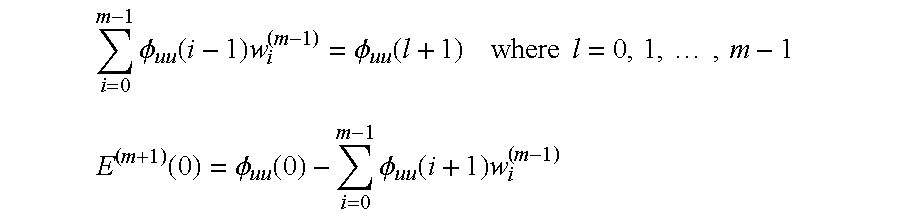
Augmenting the last two equations results in the matrix equation: 
which is expanded as follows: 
Therefore, from equation (22):
R=Q u which is defined by: 
Therefore, it can be shown that:
where E is defined by the diagonal matrix 
Equation (80) shows that residual energies at different stages of the left hand-side of the ladder, the spiking side, are orthogonal to each other which implies that different stages of the spiking side are decoupled from each other. Furthermore, the diagonal elements of E are the eigen values of the covariance matrix Φuu and can be computed directly from the reflection coefficients C0 (i) using equation (51). Since a positive definite real symmetric matrix has only positive eigen values, it follows that the conditions for positive definiteness of Φuu are satisfied if E(i) is positive for all i. From equation (51), this condition is satisfied if and only if |C0 (i)|<1 for all i. This condition guarantees that P(m+1) is minimum phase.
For the moving average ladder, the transfer coefficients, wi (i) and the reflection coefficients C0 (i) for all I can be estimated as follows:
From equations (7) and (31) 
where βk is the time varying forgetting factor.
By setting δI/δwm (m)=0 we have 
and it follows that: 
since from equations (31), (82) and (83) 
Therefore:
where: 
For the general prediction ladder, it can be shown that equation (85) is true where γt+1 is defined by: 
Estimation of the C0 (i) parameters may be carried out by minimizing the performance index:
where from equations (22), (28), and (30), it can be shown that δI/δC0 (m)(t)=0 results in: 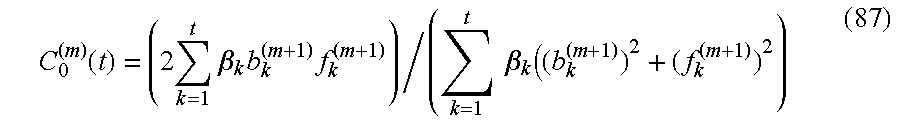
Since: 
it follows that: 
Finally the optimum dead time impulse response ladder, shown in FIG. (131), is used to estimate the optimum lag between the system input and its desired output. This ladder enables the generation of performance index contour maps as a function of filter memory length and a range of lags or prediction distances.
Accordingly, the geometric display tools, methods, and adaptive model reference tools of this invention enable the specification, analysis, synthesis, and design automation of an adaptive integrated architecture of a real system. These systems can be adapted during system development to compensate for requirement changes and design errors, and during run time operation to compensate for unanticipated operational system conditions. AMR tools enable the verification and validation of adaptive real system designs built in compliance with a declared enterprise wide technical architecture. Architecture components can be specified using AMR tools or can be imported into the AMR tool set. Although the description above contains many specifics, these should not be construed as limiting the scope of the invention but as merely providing illustrations of some of the embodiments of this invention. For example the user interface description provided in procedure 7 should be viewed as one of many different ways used to describe the look and feel of the user interface required to enable the specification, analysis, synthesis and enactment of this invention. Thus the scope of the invention should be determined by the appended claims and their legal equivalents, rather than by the examples given.
Claims (31)
1. A computer-program method embodied on a computer-readable medium and comprising code containing one or more software objects representing real objects comprised within a real-world system, said real-world system comprising one or more members of the group consisting of physical processes, information transfer equipment, data processors, associated software, human operators, and systems users, so that the code, when executed in response to human input, causes the computer to perform functions comprising generating a fractal geometric display representing the real objects, and further comprising:
(a) constructing a dynamic architecture model of said real-world system, wherein the model is geometric and is fractal;
(b) providing a data and process information specified from a user-selected set of universal modeling language graph types further comprising classification, association, aggregation, object relationship, sequence, collaboration, state-chart, activity, and implementation graphs;
(c) fusing said data and process information;thereby generating an integrated visual representation of the fused data and process model information;
(d) constructing an atomic connection, defining communication protocols used to connect a set of component objects wherein said atomic connection is token based and is geometric and fractal and the geometric region of said atomic connection does not contain models of structure objects used to implement connections between said component objects;
(e) constructing a compound connection, defining communication protocols used to connect said set of component objects wherein said compound connection is token based and is geometric and the geometric region of said compound connection contains a plurality of models of infrastructure object, comprising an integrated model, used to implement connections between said component objects;
(f) constructing an object loop of said integrated model wherein said object loop is specified using a set of said atomic connections and of said compound connections, wherein said object loop specifies cyclic performance constrained interactions between said set of component objects wherein all interactions within the boundaries of said component objects are internal interactions during one complete loop cycle;
(g) constructing an adaptive loop information network, comprising a plurality of object loops, wherein said adaptive loop information network is specified using a group of said object loops, wherein each said adaptive loop information network specifies a proper partition of a set of component objects which is observable and controllable and configurable and whose semantics match a conceptual model of external objects invoking services of said adaptive loop information networks; and
(h) constructing said dynamic architecture model using a set of said adaptive loop information networks,
thus providing the user with an architectural specification model of the real-world system.
2. The method of claim 1 , further comprising code that, when executed, in response to an human input and an automated system measurement, further comprises constructing a plan projection which is geometric and is fractal and an elevation projection which is geometric and is fractal.
3. A computer-program method embodied on a computer-readable medium and comprising code containing one or more software objects representing system objects and real objects comprised within a real-world system, said real-world system comprising one or more members of the group consisting of physical processes, information transfer equipment, data processors, associated software, human operators, and systems users, so that the code, when executed in response to human input, causes the computer to perform functions comprising:
(a) generating a fractal geometric display representing the real objects;
(b) constructing a dynamic architecture model of internal system objects and external system objects;
(c) constructing an operational requirements architecture model which is geometric and fractal, wherein the model is a dynamic architecture model; and
(d) specifying performance constrained interactions between said external system objects and said real-world system;
thus providing the user with an architectural specification model of the real-world system.
4. The method of claim 3 , wherein the real-world system further comprises internal system objects, the method further comprising using an operational requirements architecture model to construct a design control architecture model, wherein the model is a dynamic architecture model which specifies performance constrained interactions between said internal system objects, whereby a group of one or more said design control architecture models can be specified for each said operational requirements architecture model.
5. The method of claim 4 , further comprising using said design control architecture model to construct an implementation architecture model, wherein the model is a dynamic architecture model, which binds design control loops, of said design control architecture model to a programing language and a given object class library, whereby a group of one or more said implementation architectures models can be specified for each said design control architecture model.
6. The method of claim 5 , further comprising integrating said operational requirements architecture model, said design control architecture model and said implementation architecture model, constructing an integrated architecture model thereby.
7. A computer-program method embodied on a computer-readable medium and comprising code containing one or more software objects representing real objects comprised within a real-world system, said real-world system comprising one or more members of the group consisting of physical processes, information transfer equipment, data processors, associated software, human operators, and systems users, and further comprising component objects, so that the code, when executed in response to human input, causes the computer to perform functions, comprising:
(a) generating a fractal geometric display representing the real objects;
(b) constructing an operational plan and a schedule of said component objects;
(c) housing a set of said component objects in one or more physical space regions;
(d) constructing a plurality of information state space regions which specify a static structure and a dynamic behavior of said component objects;
(e) constructing an integrated space grid of said real-world system which comprises cells, is geometric and is fractal and is multi-layered wherein said cells fuse the physical space regions and the information state space regions;
(f) constructing one or more adaptive loop information networks, each comprising a plurality of object loops, and each comprising a set of said component objects;
(g) constructing an instance of each said adaptive loop information network,
(h) specifying initial configuration and physical space constraints of said adaptive loop information network instance;
(i) constructing a plan which specifies the routing and connection of the component objects of said instance of adaptive loop information network; and
(j) scheduling, directing, monitoring, and adapting said components objects specified in said plan,
thus providing the user with an architectural specification model of the real-world system.
8. A computer-program method embodied on a computer-readable medium and comprising code containing one or more software objects representing real objects comprised within a real-world system, said real-world system comprising one or more members of the group consisting of physical processes, information transfer equipment, data processors, associated software, human operators, and systems users, so that the code, when executed in response to human input, causes the computer to perform functions comprising generating a fractal geometric display representing the real objects, further comprising:
(a) constructing a software concurrent application control process, which is a set of said component objects said real-world system, further comprising:
(b) constructing a user-selected set comprising a reliable communication controller, a security controller, an activation controller, a reliable configuration controller, a concurrency controller, and a monitoring controller whereby controller components of said software concurrent application control process further comprise enforcing static and dynamic constraints associated with segments of said instances of adaptive loop information network instances upon said software concurrent application control process;
(c) configuring and executing segments of said instances of adaptive loop information network, which are allocated to said software concurrent application control process; and
(d) enabling interactions between said software concurrent control processes using run time system environments,
thus providing the user with an architectural specification model of the real-world system.
9. A computer-program method embodied on a computer-readable medium and comprising code containing one or more software objects representing real objects comprised within a real-world system, said real-world system comprising one or more members of the group consisting of physical processes, information transfer equipment, data processors, associated software, human operators, and systems users, so that the code, when executed in response to human input, causes the computer to perform functions comprising:
(a) generating a fractal geometric display representing the real objects,
(b) constructing an adaptive supervisory application control process;
(c) constructing a user-selected set comprising an overload monitor controller and a learning controller and a performance controller and a configuration controller;
(d) coordinating a group of adaptive supervisory control processes to implement and adapt a functional performance behavior of an integrated architecture model;
(e) including one or more adaptive loop information networks, each further comprising segments;
(f) configuring and executing said segments; and
(g) estimating a system model order and an associated dead time; parameters for a system with time varying properties,
whereby said adaptive supervisory design control scheme enables the run time monitoring, control and adaptation of the behavior of an automated operational system, thus providing the user with an architectural specification model of the real-world system.
10. A computer-program method embodied on a computer-readable medium and comprising code containing one or more software objects representing real objects comprised within a real-world system, said real-world system comprising one or more members of the group consisting of physical processes, information transfer equipment, data processors, associated software, human operators, and systems users comprising current and proposed business operations, so that the code, when executed in response to human input, causes the computer to perform functions comprising:
(a) generating a fractal geometric display representing the real objects;
(b) activating the computer to evaluate a cost and a value of said real-world system;
(c) configuring one or more adaptive loop information networks, further comprising specifying business operations of said real-world system;
(d) constructing a dynamic architecture model of said real-world system, wherein the model is geometric and is fractal;
(e) constructing an adaptive simulator further comprising incorporating a simulation engine to implement said dynamic architecture models; and
(f) computing performance sensitivity metrics of an adaptive loop information networks specification of current and proposed business operations,
thus providing the user with an architectural specification model of the real-world system.
11. The method of claim 10 , further comprising generating architecture projection displays of said static architecture model and said dynamic architecture model and said integrated architecture model, wherein said displays are created in compliance with static and dynamic constraints associated with said adaptive loop information networks and said adaptive loop information network instances, and further comprising generating a user-selected group comprising an object state display, a dynamic graph display, a business tracking graph display, and a business control graph.
12. A computer-program method embodied on a computer-readable medium and comprising code containing one or more software objects representing real objects comprised within a real-world system, said real-world system comprising one or more members of the group consisting of physical processes, information transfer equipment, data processors, associated software, human operators, and systems users, so that the code, when executed in response to human input, causes the computer to perform functions comprising:
(a) generating a fractal geometric display representing the real objects;
(b) constructing a knowledge controller which further comprises a group of objects within an integrated architecture model;
(c) constructing a multilevel schema wherein a schema level is defined for each level of an abstraction of an adaptive loop information network;
(d) using said multilevel schema to construct a plurality of semantic filters wherein a group of said semantic filters are used to regulate access to data managed by said knowledge controller; and
(e) constructing said knowledge controller using an overload controller, a learning controller, a performance controller, and a configuration controller,
thus providing the user with an architectural specification model of the real-world system.
13. A computer-program method embodied on a computer-readable medium and comprising code containing one or more software objects representing real objects comprised within a real-world system, wherein the real objects are members of the group which consists of mechatronic objects, infotronic objects, human objects, and human organization objects, the real-world system further comprising a multiplicity of unique segments in a spatial state time grid comprising an evolution structure, so that the code, when executed in response to human input, causes the computer to perform functions comprising:
(a) generating a fractal geometric display representing the real objects;
(b) configuring said display as a multiplicity of cells,
(c) configuring said display to be virtual and wrap-around;
(d) representing each unique segment by one of the cells, wherein a representation of the evolution structure is contained within said cell; and
(e) representing each cell by two adjacent triangular display tiles,
thus providing the user with a specification model of the real-world system.
14. The method of claim 13 , wherein each of the cells further comprises subdividing each cell into a multiplicity of atomic regions further comprising operation regions, resource regions, referential attribute regions, and public interface regions.
15. The method of claim 14 , further comprising folding and unfolding said regions.
16. The method of claim 15 , further comprising fractally and geometrically displaying a multi-layered stack of components representing real objects, wherein said stack of components further comprises a plan projection and an elevation projection.
17. A computer-program method embodied on a computer-readable medium and comprising code containing one or more software objects representing real objects comprised within a real-world system, so that the code, when executed in response to human input, causes the computer to perform functions comprising generating a fractal geometric display representing the real objects, and further comprising:
(a) constructing a dynamic architecture model of said real-world system, wherein the model is geometric and is fractal;
(b) providing a data and process information specified from a user-selected set of universal modeling language graph types further comprising classification, association, aggregation, object relationship, sequence, collaboration, state-chart, activity, and implementation graphs;
(c) fusing said data and process information; thereby generating an integrated visual representation of the fused data and process model information;
(d) constructing an atomic connection, defining communication protocols used to connect a set of component objects wherein said atomic connection is token based and is geometric and fractal and the geometric region of said atomic connection does not contain models of infrastructure objects used to implement connections between said component objects;
(e) constructing a compound connection, defining communication protocols used to connect said set of component objects wherein said compound connection is token based and is geometric and the geometric region of said compound connection contains a plurality of models of infrastructure object, comprising an integrated model, used to implement connections between said component objects;
(f) constructing an object loop of said integrated model wherein said object loop is specified using a set of said atomic connections and of said compound connections, wherein said object loop specifies cyclic performance constrained interactions between said set of component objects wherein all interactions within the boundaries of said component objects are internal interactions during one complete loop cycle;
(g) constructing an adaptive loop information network, comprising a plurality of object loops, wherein said adaptive loop information network is specified using a group of said object loops, wherein each said adaptive loop information network specifies a proper partition of a set of component objects which is observable and controllable and configurable and whose semantics match a conceptual model of external objects invoking services of said adaptive loop information networks;
(h) constructing said dynamic architecture model using a set of said adaptive loop information networks; and
(i) constructing
(I) a plan projection which is geometric and is fractal; and
(II) an elevation projection which is geometric and is fractal,
when the code is executed in response to an human input and an automated system measurement,
thus providing the user with a specification model of the real-world system.
18. The method of claim 17 , further comprising constructing a minimum dynamic architecture model of said dynamic architecture model.
19. A computer-program method embodied on a computer-readable medium and comprising code containing one or more software objects representing real objects comprised within a real-world system comprising current and proposed business operations, so that the code, when executed in response to human input, causes the computer to perform functions comprising:
(a) generating a fractal geometric display representing the real objects;
(b) activating the computer to evaluate a cost and a value of said real-world system;
(c) configuring one or more adaptive loop information networks, further comprising specifying business operations of said real-world system;
(d) constructing a dynamic architecture model of said real-world system, wherein the model is geometric and is fractal;
(e) constructing an adaptive simulator further comprising incorporating a simulation engine to implement said dynamic architecture models;
(f) computing performance sensitivity metrics of an adaptive loop information networks specification of current and proposed business operations,
(g) generating architecture projection displays of said static architecture model, said dynamic architecture model, and said integrated architecture model, wherein said displays are created in compliance with static and dynamic constraints associated with said adaptive loop information networks and said adaptive loop information network instances, and
(h) further comprising generating a user-selected group comprising an object state display, a dynamic graph display, a business tracking graph display, and a business control graph,
thus providing the user with a specification model of the real-world system.
20. The method of claim 19 , further comprising evaluating a user-selected set of static structure metrics of said adaptive loop information networks, wherein said static structure metrics further comprise fractal dimension metrics, entropy coupling metrics, boundedness metrics, deadlock metrics, and liveness metrics.
21. The method of claim 20 , further comprising an automated system measuring, and an evaluating of a user-selected set of dynamic structure metrics of said adaptive loop information networks of said integrated architecture model using data collected by a set of software concurrent application control processes, wherein said dynamic structure metrics further comprise load metrics, service time metrics, response time metrics, and utilization level metrics.
22. A computer-program method embodied on a computer-readable medium and comprising code containing one or more software objects representing real objects comprised within a real-world system, said real-world system comprising one or more members of the group consisting of physical processes, information transfer equipment, data processors, associated software, human operators, and systems users, so that the code, when executed in response to human input, causes the computer to perform functions comprising generating a fractal geometric display representing the real objects; thus providing the user with an architectural specification model of the real-world system.
23. The method of claim 22 , wherein each real object further comprises an entity with a well-defined boundary and identity that encapsulates state and behavior, wherein state comprises a representation of one or more data attributes and one or more relationships, and wherein behavior comprises a representation of one or more operations, one or more methods, and one or more state machines.
24. The method of claim 22 , further comprising configuring said display as a multiplicity of cells.
25. The method of claim 24 , wherein said fractal geometric display is virtual and wraparound.
26. The method of claim 25 , wherein said real-world system further comprises a multiplicity of unique segments in a spatial state time grid comprising an evolution structure, the method further comprising representing each unique segment by one of the cells, wherein a representation of the evolution structure is contained within said cell.
27. The method of claim 26 , further comprising representing each cell by two adjacent triangular display tiles.
28. The method of claim 27 , wherein the real objects are members of the group which consists of mechatronic objects, infotronic objects, human objects, and human organization objects.
29. The method of claim 28 , further comprising:
(a) constructing a fractal geometric model of a classification relationship between said real objects;
(b) constructing a fractal geometric model of an association relationship between said real objects;
(c) constructing a fractal geometric model of a composition relationship between said real objects;
(d) constructing a static architecture model using fractal geometric models of said classification relationship, said association relationship, and said composition relationship.
30. The method of claim 29 , further comprising constructing a minimum static architecture model version of said static architecture model, using a minimal orthogonal set of object attributes and a minimal orthogonal set of functions operating on said software objects.
31. The method of claims 1, 3, 7, 8, 9, 10, or 12, further comprising using an automated system measurement, providing an integrated architecture model, and constructing an iterative map of the integrated architecture model thereby.
Priority Applications (2)
| Application Number | Priority Date | Filing Date | Title |
|---|---|---|---|
| US09/299,235 US6789054B1 (en) | 1999-04-25 | 1999-04-25 | Geometric display tools and methods for the visual specification, design automation, and control of adaptive real systems |
| PCT/US2000/010992 WO2000065488A1 (en) | 1999-04-25 | 2000-04-24 | Geometric display tools and methods for the visual specification, design automation, and control of adaptive real systems |
Applications Claiming Priority (1)
| Application Number | Priority Date | Filing Date | Title |
|---|---|---|---|
| US09/299,235 US6789054B1 (en) | 1999-04-25 | 1999-04-25 | Geometric display tools and methods for the visual specification, design automation, and control of adaptive real systems |
Publications (1)
| Publication Number | Publication Date |
|---|---|
| US6789054B1 true US6789054B1 (en) | 2004-09-07 |
Family
ID=23153917
Family Applications (1)
| Application Number | Title | Priority Date | Filing Date |
|---|---|---|---|
| US09/299,235 Expired - Fee Related US6789054B1 (en) | 1999-04-25 | 1999-04-25 | Geometric display tools and methods for the visual specification, design automation, and control of adaptive real systems |
Country Status (2)
| Country | Link |
|---|---|
| US (1) | US6789054B1 (en) |
| WO (1) | WO2000065488A1 (en) |
Cited By (200)
| Publication number | Priority date | Publication date | Assignee | Title |
|---|---|---|---|---|
| US20020019797A1 (en) * | 2000-02-16 | 2002-02-14 | Rocky Stewart | Message routing system for enterprise wide electronic collaboration |
| US20020087600A1 (en) * | 1999-09-22 | 2002-07-04 | Newbold David Leroy | Method and system for profiling users based on their relationships with content topics |
| US20020129082A1 (en) * | 2001-03-08 | 2002-09-12 | International Business Machines Corporation | Inter-partition message passing method, system and program product for throughput measurement in a partitioned processing environment |
| US20020188436A1 (en) * | 1998-02-10 | 2002-12-12 | Gunter Schmidt | Nth- order fractal network for handling complex structures |
| US20030018402A1 (en) * | 2001-07-19 | 2003-01-23 | Breunese Arno Pieter Jan | System for controlling and monitoring a process |
| US20030084228A1 (en) * | 2001-10-31 | 2003-05-01 | Bernard Hautbergue | Parametring and automatic compilation of structures using standard representation networks |
| US20030105884A1 (en) * | 2001-10-18 | 2003-06-05 | Mitch Upton | System and method for using Web services with an enterprise system |
| US20030135489A1 (en) * | 2002-01-14 | 2003-07-17 | Goodwin James Patrick | System and method for processing data in a distributed architecture |
| US20040032700A1 (en) * | 2000-06-20 | 2004-02-19 | Noriaki Matsuno | Base bias circuit, and power amplifier using the base bias circuit |
| US20040054508A1 (en) * | 2002-05-31 | 2004-03-18 | Mc Cabe Alejandro Javier Spiritoso | Method for modeling and viewing real world objects in a network model at real world times |
| US20040078440A1 (en) * | 2002-05-01 | 2004-04-22 | Tim Potter | High availability event topic |
| US20040122534A1 (en) * | 2002-08-30 | 2004-06-24 | Paulin Matthew A. | Method for facilitating computer-based modeling |
| US20040122950A1 (en) * | 2002-12-20 | 2004-06-24 | Morgan Stephen Paul | Method for managing workloads in an autonomic computer system for improved performance |
| US20040167915A1 (en) * | 2003-02-25 | 2004-08-26 | Bea Systems, Inc. | Systems and methods for declaratively transforming data objects between disparate representations |
| US20040172618A1 (en) * | 2003-02-28 | 2004-09-02 | Bea Systems, Inc. | Systems and methods for a common runtime container framework |
| US20040187127A1 (en) * | 2003-02-25 | 2004-09-23 | Albert Gondi | Systems and methods for transaction chaining |
| US20040225995A1 (en) * | 2003-02-28 | 2004-11-11 | Kyle Marvin | Reusable software controls |
| US20050021546A1 (en) * | 2000-11-10 | 2005-01-27 | Microsoft Corporation | Distributed data gathering and aggregation agent |
| US20050034104A1 (en) * | 2003-02-26 | 2005-02-10 | Bea Systems, Inc. | Method for multi-language debugging |
| US20050038764A1 (en) * | 2003-06-04 | 2005-02-17 | Steven Minsky | Relational logic management system |
| US20050090929A1 (en) * | 2002-10-21 | 2005-04-28 | Siemens Aktiengesellschaft | Apparatus and method for simulation of the control and machine behavior of machine tools and production-line machines |
| US20050108682A1 (en) * | 2003-02-26 | 2005-05-19 | Bea Systems, Inc. | Systems for type-independent source code editing |
| US20050114384A1 (en) * | 2003-08-29 | 2005-05-26 | Joerg Beringer | Methods and systems for providing a visualization graph |
| US20050114771A1 (en) * | 2003-02-26 | 2005-05-26 | Bea Systems, Inc. | Methods for type-independent source code editing |
| US20050149909A1 (en) * | 2001-01-23 | 2005-07-07 | Batcha Thomas R. | System and method of designing, testing, and employing graphical computer code |
| US20050149308A1 (en) * | 2002-04-09 | 2005-07-07 | Commissariat A L'energie Atomoque | Biscuit product that can be used to improve nutritional prevention of the harmful effects associated with oxidative stress |
| US20050160166A1 (en) * | 2003-12-17 | 2005-07-21 | Kraenzel Carl J. | System and method for monitoring a communication and retrieving information relevant to the communication |
| US6937968B1 (en) * | 1999-01-21 | 2005-08-30 | Analytical Graphics, Inc. | Method and apparatus for sequentially profiling and solving problems in space mission analysis |
| US20050267731A1 (en) * | 2004-05-27 | 2005-12-01 | Robert Allen Hatcherson | Container-based architecture for simulation of entities in a time domain |
| US20050273736A1 (en) * | 2004-06-03 | 2005-12-08 | Lsi Logic Corporation | Rules and directives for validating correct data used in the design of semiconductor products |
| US20060004872A1 (en) * | 2004-06-30 | 2006-01-05 | International Business Machines Corporation | Visualizing and modeling interaction relationship among entities |
| US20060015315A1 (en) * | 2003-11-19 | 2006-01-19 | Schneider Electric Gmbh | Process for developing and implementing a model for the formal description of a collaborative system comprised of multiple distributed components, especially an intelligent, flexible production and/or process automation system |
| US20060037019A1 (en) * | 2004-07-23 | 2006-02-16 | Austin Mark A | Tree-to-graph folding procedure for systems engineering requirements |
| US20060080369A1 (en) * | 2004-03-04 | 2006-04-13 | Mathsoft Engineering & Education, Inc. | Method for automatically enabling traceability of engineering calculations |
| US20060149731A1 (en) * | 2005-01-05 | 2006-07-06 | Schirmer Andrew L | System and method for deriving affinity relationships between objects |
| US20060195407A1 (en) * | 1999-04-19 | 2006-08-31 | Definiens Ag | Situation dependent operation of a semantic network machine |
| US20060212268A1 (en) * | 2005-03-17 | 2006-09-21 | Hans-Joachim Beck | Diagnosis of an automation system |
| US20060282252A1 (en) * | 2005-05-31 | 2006-12-14 | The Mathworks, Inc. | Modeling of a multiprocessor system |
| US20070106490A1 (en) * | 2004-07-01 | 2007-05-10 | Fujitsu Limited | Verification support method, verification supporting apparatus, and computer product |
| US20070106975A1 (en) * | 2005-11-04 | 2007-05-10 | Microsoft Corporation | Cartographic software maps |
| US20070168096A1 (en) * | 2004-01-13 | 2007-07-19 | Renault S.A.S. | Design of safety critical systems |
| US20070180424A1 (en) * | 2004-03-02 | 2007-08-02 | Evgeny Kazakov | Device, system and method for accelerated modeling |
| US20070198467A1 (en) * | 2002-05-01 | 2007-08-23 | Bea Systems, Inc. | System and method for storing large messages |
| US20070239505A1 (en) * | 2006-03-30 | 2007-10-11 | Microsoft Corporation | Abstract execution model for a continuation-based meta-runtime |
| US20070261012A1 (en) * | 2006-03-23 | 2007-11-08 | Fujitsu Limited | Systematic generation of scenarios from specification sheet |
| US20070288899A1 (en) * | 2006-06-13 | 2007-12-13 | Microsoft Corporation | Iterative static and dynamic software analysis |
| US20080015909A1 (en) * | 2005-11-01 | 2008-01-17 | Piali De | Mission profiling |
| US20080040704A1 (en) * | 2006-08-14 | 2008-02-14 | Payman Khodabandehloo | Design tool and methodology for enterprise software applications |
| US20080065445A1 (en) * | 2000-03-06 | 2008-03-13 | Livesay Jeffrey A | Method and process for providing relevant data, comparing proposal alternatives, and reconciling proposals, invoices, and purchase orders with actual costs in a workflow process |
| US20080123559A1 (en) * | 2006-08-07 | 2008-05-29 | Voltaire Ltd. | Service-oriented infrastructure management |
| US7424717B2 (en) | 2002-05-01 | 2008-09-09 | Bea Systems, Inc. | Systems and methods for business process plug-in development |
| US7441238B2 (en) | 2003-02-26 | 2008-10-21 | Bea Systems, Inc. | Extendable compiler framework |
| US20080263480A1 (en) * | 2004-06-03 | 2008-10-23 | Lsi Corporation | Language and templates for use in the design of semiconductor products |
| US7480647B1 (en) | 2000-12-05 | 2009-01-20 | Microsoft Corporation | Performance logging solution |
| US7484224B2 (en) | 2002-05-02 | 2009-01-27 | Bae Systems, Inc. | Adapter deployment without recycle |
| US7493628B2 (en) | 2002-05-02 | 2009-02-17 | Bea Systems, Inc. | Shared common connection factory |
| US20090089227A1 (en) * | 2007-09-28 | 2009-04-02 | Rockwell Automation Technologies, Inc. | Automated recommendations from simulation |
| US20090089030A1 (en) * | 2007-09-28 | 2009-04-02 | Rockwell Automation Technologies, Inc. | Distributed simulation and synchronization |
| US20090089029A1 (en) * | 2007-09-28 | 2009-04-02 | Rockwell Automation Technologies, Inc. | Enhanced execution speed to improve simulation performance |
| US20090089121A1 (en) * | 2007-09-27 | 2009-04-02 | Siemens Aktiengesellschaft | Method and system for controlling a project |
| US20090089234A1 (en) * | 2007-09-28 | 2009-04-02 | Rockwell Automation Technologies, Inc. | Automated code generation for simulators |
| US20090089031A1 (en) * | 2007-09-28 | 2009-04-02 | Rockwell Automation Technologies, Inc. | Integrated simulation of controllers and devices |
| US7539985B2 (en) | 2003-02-26 | 2009-05-26 | Bea Systems, Inc. | Systems and methods for dynamic component versioning |
| US7552222B2 (en) | 2001-10-18 | 2009-06-23 | Bea Systems, Inc. | Single system user identity |
| US20090249129A1 (en) * | 2007-10-12 | 2009-10-01 | David Femia | Systems and Methods for Managing Multi-Component Systems in an Infrastructure |
| US20090249301A1 (en) * | 2008-03-31 | 2009-10-01 | International Business Machines Corporation | Method and Apparatus for Testing Soft Error Rate of an Application Program |
| US20090262376A1 (en) * | 2006-09-15 | 2009-10-22 | Hideki Aoyama | Grain pattern for grain pattern printing, method and program for creating grain pattern, and housing building material product, automotive interior part, electric home appliance, and information equipment with grain pattern printed thereon |
| US20090268628A1 (en) * | 1999-08-19 | 2009-10-29 | Massachusetts Institute Of Technology | Synchronous Circuit Synthesis Using An Asynchronous Specification |
| US20090287321A1 (en) * | 2003-02-18 | 2009-11-19 | Fisher-Rosemount Systems, Inc. | Configuration system using security objects in a process plant |
| US7627631B2 (en) | 2002-05-02 | 2009-12-01 | Bea Systems, Inc. | Systems and methods for collaborative business plug-ins |
| US7636697B1 (en) * | 2007-01-29 | 2009-12-22 | Ailive Inc. | Method and system for rapid evaluation of logical expressions |
| US7636722B2 (en) | 2003-02-28 | 2009-12-22 | Bea Systems, Inc. | System and method for describing application extensions in XML |
| US20090319239A1 (en) * | 2008-06-18 | 2009-12-24 | International Business Machines Corporation | Topology modeling application that handles abstract entities through the realization of conceptual objects |
| US20090319058A1 (en) * | 2008-06-20 | 2009-12-24 | Invensys Systems, Inc. | Systems and methods for immersive interaction with actual and/or simulated facilities for process, environmental and industrial control |
| US7650592B2 (en) | 2003-03-01 | 2010-01-19 | Bea Systems, Inc. | Systems and methods for multi-view debugging environment |
| US7650276B2 (en) | 2003-02-26 | 2010-01-19 | Bea Systems, Inc. | System and method for dynamic data binding in distributed applications |
| US20100031247A1 (en) * | 2008-07-29 | 2010-02-04 | International Business Machines Corporation | Simplified deployment modeling |
| US20100030893A1 (en) * | 2008-07-29 | 2010-02-04 | International Business Machines Corporation | Automated discovery of a topology of a distributed computing environment |
| US20100042572A1 (en) * | 2008-08-12 | 2010-02-18 | Haitham Mahmoud Al-Beik | Method for Dynamically Determining a Predetermined Previous Condition of a Rule-based System |
| US20100058331A1 (en) * | 2008-08-28 | 2010-03-04 | International Business Machines Corporation | Automated deployment of defined topology in distributed computing environment |
| US7676538B2 (en) | 2002-05-02 | 2010-03-09 | Bea Systems, Inc. | Systems and methods for application view transactions |
| US20100070449A1 (en) * | 2008-09-12 | 2010-03-18 | International Business Machines Corporation | Deployment pattern realization with models of computing environments |
| US20100077328A1 (en) * | 2008-09-23 | 2010-03-25 | International Business Machines Corporation | Automatically arranging widgets of a model within a canvas using iterative region based widget relative adjustments |
| US7689629B1 (en) | 1999-03-30 | 2010-03-30 | Definiens Ag | Method of the use of fractal semantic networks for all types of database applications |
| US20100088664A1 (en) * | 2006-08-14 | 2010-04-08 | Payman Khodabandehloo | Design tool and methodology for enterprise software applications |
| US7707564B2 (en) | 2003-02-26 | 2010-04-27 | Bea Systems, Inc. | Systems and methods for creating network-based software services using source code annotations |
| US20100169880A1 (en) * | 2008-12-25 | 2010-07-01 | Voltaire Ltd. | Virtual input-output connections for machine virtualization |
| US7752599B2 (en) | 2003-02-25 | 2010-07-06 | Bea Systems Inc. | Systems and methods extending an existing programming language with constructs |
| US7752017B1 (en) * | 2005-03-24 | 2010-07-06 | Moca Systems, Inc. | System and method for simulating resource allocation |
| US7774697B2 (en) | 2003-02-25 | 2010-08-10 | Bea Systems, Inc. | System and method for structuring distributed applications |
| US20100275200A1 (en) * | 2009-04-22 | 2010-10-28 | Dell Products, Lp | Interface for Virtual Machine Administration in Virtual Desktop Infrastructure |
| US20100293025A1 (en) * | 2009-05-15 | 2010-11-18 | International Business Machines Corporation | Dimensional service-oriented architecture solution modeling and composition |
| US7840611B2 (en) | 2002-05-01 | 2010-11-23 | Oracle International Corporation | High availability for event forwarding |
| US7844636B2 (en) | 2003-02-25 | 2010-11-30 | Oracle International Corporation | Systems and methods for client-side filtering of subscribed messages |
| US20100305721A1 (en) * | 2009-05-29 | 2010-12-02 | Invensys Systems, Inc. | Methods and apparatus for control configuration with control objects that self-define tracked parameters |
| US20100318339A1 (en) * | 2007-09-28 | 2010-12-16 | Rockwell Automation Technologies, Inc. | Simulation controls for model variablity and randomness |
| CN101944063A (en) * | 2010-09-21 | 2011-01-12 | 南京中德保护控制系统有限公司 | Real-time dynamic scheduling policy test method based on digital microkernel |
| US7873200B1 (en) | 2006-10-31 | 2011-01-18 | United Services Automobile Association (Usaa) | Systems and methods for remote deposit of checks |
| US20110016074A1 (en) * | 2009-07-16 | 2011-01-20 | International Business Machines | Method and system for encapsulation and re-use of models |
| US7876949B1 (en) | 2006-10-31 | 2011-01-25 | United Services Automobile Association | Systems and methods for remote deposit of checks |
| US7885880B1 (en) * | 2008-09-30 | 2011-02-08 | United Services Automobile Association (Usaa) | Atomic deposit transaction |
| US7885451B1 (en) | 2006-10-31 | 2011-02-08 | United Services Automobile Association (Usaa) | Systems and methods for displaying negotiable instruments derived from various sources |
| US7896232B1 (en) | 2007-11-06 | 2011-03-01 | United Services Automobile Association (Usaa) | Systems, methods, and apparatus for receiving images of one or more checks |
| US20110054873A1 (en) * | 2009-08-31 | 2011-03-03 | Siemens Product Lifecycle Management Software Inc. | System and method for creation of function-based mechatronic objects |
| US7900822B1 (en) | 2007-11-06 | 2011-03-08 | United Services Automobile Association (Usaa) | Systems, methods, and apparatus for receiving images of one or more checks |
| US20110078652A1 (en) * | 2005-05-31 | 2011-03-31 | The Mathworks, Inc. | Graphical partitioning for parallel execution of executable block diagram models |
| US20110090402A1 (en) * | 2006-09-07 | 2011-04-21 | Matthew Huntington | Method and system to navigate viewable content |
| US7949587B1 (en) | 2008-10-24 | 2011-05-24 | United States Automobile Association (USAA) | Systems and methods for financial deposits by electronic message |
| US20110125635A1 (en) * | 2001-03-15 | 2011-05-26 | David Chao | Method and system for managing distributor information |
| US7953787B2 (en) | 2002-05-02 | 2011-05-31 | Oracle International Corporation | System and method for providing highly available processing of asynchronous requests using distributed request and response queues and a service processor |
| US20110131137A1 (en) * | 2001-06-29 | 2011-06-02 | Shari Gharavy | Method and apparatus for performing collective validation of credential information |
| US7958076B2 (en) | 2007-11-30 | 2011-06-07 | Stratus Technologies Bermuda Ltd. | System and methods for managing rules and detecting reciprocal dependencies |
| US7962411B1 (en) | 2008-09-30 | 2011-06-14 | United Services Automobile Association (Usaa) | Atomic deposit transaction |
| US7970677B1 (en) | 2008-10-24 | 2011-06-28 | United Services Automobile Association (Usaa) | Systems and methods for financial deposits by electronic message |
| US7974899B1 (en) | 2008-09-30 | 2011-07-05 | United Services Automobile Association (Usaa) | Atomic deposit transaction |
| US7996314B1 (en) | 2007-10-30 | 2011-08-09 | United Services Automobile Association (Usaa) | Systems and methods to modify a negotiable instrument |
| US7996316B1 (en) | 2007-10-30 | 2011-08-09 | United Services Automobile Association | Systems and methods to modify a negotiable instrument |
| US7996315B1 (en) | 2007-10-30 | 2011-08-09 | United Services Automobile Association (Usaa) | Systems and methods to modify a negotiable instrument |
| US8001051B1 (en) | 2007-10-30 | 2011-08-16 | United Services Automobile Association (Usaa) | Systems and methods to modify a negotiable instrument |
| US8015572B2 (en) | 2002-02-22 | 2011-09-06 | Oracle International Corporation | Systems and methods for an extensible software proxy |
| US20110231197A1 (en) * | 2001-03-15 | 2011-09-22 | David Chao | Framework for processing sales transaction data |
| US8028272B2 (en) | 1999-05-17 | 2011-09-27 | Invensys Systems, Inc. | Control system configurator and methods with edit selection |
| US8046301B1 (en) | 2007-10-30 | 2011-10-25 | United Services Automobile Association (Usaa) | Systems and methods to modify a negotiable instrument |
| US20110295391A1 (en) * | 2010-05-25 | 2011-12-01 | Siemens Product Lifecycle Management Software Inc. | Method and System for Closed-Loop Controller Programming |
| US20110307905A1 (en) * | 2010-06-15 | 2011-12-15 | Microsoft Corporation | Indicating parallel operations with user-visible events |
| US8090452B2 (en) | 1999-06-11 | 2012-01-03 | Invensys Systems, Inc. | Methods and apparatus for control using control devices that provide a virtual machine environment and that communicate via an IP network |
| US8127060B2 (en) | 2009-05-29 | 2012-02-28 | Invensys Systems, Inc | Methods and apparatus for control configuration with control objects that are fieldbus protocol-aware |
| US8135772B2 (en) | 2002-05-01 | 2012-03-13 | Oracle International Corporation | Single servlets for B2B message routing |
| US8140302B1 (en) * | 2005-12-15 | 2012-03-20 | The Mathworks, Inc. | Method for using variable structure in physical modeling |
| US20120117124A1 (en) * | 2008-08-06 | 2012-05-10 | Statoil Petroleum As | Interactive rendering of physical entities |
| US8209201B1 (en) * | 2005-12-08 | 2012-06-26 | Hewlett-Packard Development Company, L.P. | System and method for correlating objects |
| US8290237B1 (en) | 2007-10-31 | 2012-10-16 | United Services Automobile Association (Usaa) | Systems and methods to use a digital camera to remotely deposit a negotiable instrument |
| US8320657B1 (en) | 2007-10-31 | 2012-11-27 | United Services Automobile Association (Usaa) | Systems and methods to use a digital camera to remotely deposit a negotiable instrument |
| US8331855B2 (en) | 2010-07-12 | 2012-12-11 | Invensys Systems, Inc. | Methods and apparatus for process control with improved communication links |
| US8351677B1 (en) | 2006-10-31 | 2013-01-08 | United Services Automobile Association (Usaa) | Systems and methods for remote deposit of checks |
| US8351678B1 (en) | 2008-06-11 | 2013-01-08 | United Services Automobile Association (Usaa) | Duplicate check detection |
| CN102880517A (en) * | 2012-09-29 | 2013-01-16 | 中国人民解放军国防科学技术大学 | Method for scheduling objects of HLA (high level architecture) simulation program on basis of super computer |
| US8358826B1 (en) | 2007-10-23 | 2013-01-22 | United Services Automobile Association (Usaa) | Systems and methods for receiving and orienting an image of one or more checks |
| US8368640B2 (en) | 1999-05-17 | 2013-02-05 | Invensys Systems, Inc. | Process control configuration system with connection validation and configuration |
| US8391599B1 (en) | 2008-10-17 | 2013-03-05 | United Services Automobile Association (Usaa) | Systems and methods for adaptive binarization of an image |
| US20130080140A1 (en) * | 2011-09-23 | 2013-03-28 | The Mathworks, Inc. | Using a requirements framework |
| US8422758B1 (en) | 2008-09-02 | 2013-04-16 | United Services Automobile Association (Usaa) | Systems and methods of check re-presentment deterrent |
| US8433127B1 (en) | 2007-05-10 | 2013-04-30 | United Services Automobile Association (Usaa) | Systems and methods for real-time validation of check image quality |
| US8452689B1 (en) | 2009-02-18 | 2013-05-28 | United Services Automobile Association (Usaa) | Systems and methods of check detection |
| US8463964B2 (en) | 2009-05-29 | 2013-06-11 | Invensys Systems, Inc. | Methods and apparatus for control configuration with enhanced change-tracking |
| US8494857B2 (en) | 2009-01-06 | 2013-07-23 | Regents Of The University Of Minnesota | Automatic measurement of speech fluency |
| US20130211871A1 (en) * | 2012-02-09 | 2013-08-15 | International Business Machines Corporation | Assessment and rationalization of resiliency of data center strategies |
| US8522217B2 (en) | 2010-04-20 | 2013-08-27 | Microsoft Corporation | Visualization of runtime analysis across dynamic boundaries |
| US8538124B1 (en) | 2007-05-10 | 2013-09-17 | United Services Auto Association (USAA) | Systems and methods for real-time validation of check image quality |
| US8542921B1 (en) | 2009-07-27 | 2013-09-24 | United Services Automobile Association (Usaa) | Systems and methods for remote deposit of negotiable instrument using brightness correction |
| US8688579B1 (en) | 2010-06-08 | 2014-04-01 | United Services Automobile Association (Usaa) | Automatic remote deposit image preparation apparatuses, methods and systems |
| US8699779B1 (en) | 2009-08-28 | 2014-04-15 | United Services Automobile Association (Usaa) | Systems and methods for alignment of check during mobile deposit |
| US8708227B1 (en) | 2006-10-31 | 2014-04-29 | United Services Automobile Association (Usaa) | Systems and methods for remote deposit of checks |
| US20140149084A1 (en) * | 2012-11-27 | 2014-05-29 | Autodesk, Inc. | Goal-driven computer aided design workflow |
| USRE44964E1 (en) * | 2003-02-28 | 2014-06-24 | Omnex Systems L.L.C. | Quality information management system |
| US8793652B2 (en) | 2012-06-07 | 2014-07-29 | International Business Machines Corporation | Designing and cross-configuring software |
| US8799147B1 (en) | 2006-10-31 | 2014-08-05 | United Services Automobile Association (Usaa) | Systems and methods for remote deposit of negotiable instruments with non-payee institutions |
| US8909722B2 (en) | 2007-03-07 | 2014-12-09 | True Engineering Technology, Llc | System and method of supporting constructive discourse on computers and mobile devices |
| US8959033B1 (en) | 2007-03-15 | 2015-02-17 | United Services Automobile Association (Usaa) | Systems and methods for verification of remotely deposited checks |
| US8977571B1 (en) | 2009-08-21 | 2015-03-10 | United Services Automobile Association (Usaa) | Systems and methods for image monitoring of check during mobile deposit |
| US9015593B2 (en) | 2008-12-01 | 2015-04-21 | International Business Machines Corporation | Managing advisories for complex model nodes in a graphical modeling application |
| US9095002B2 (en) | 2010-07-12 | 2015-07-28 | Invensys Systems, Inc. | Methods and apparatus for process control with improved communication links |
| US9152877B2 (en) | 2010-11-24 | 2015-10-06 | Indian Statistical Institute | Rough wavelet granular space and classification of multispectral remote sensing image |
| US9159101B1 (en) | 2007-10-23 | 2015-10-13 | United Services Automobile Association (Usaa) | Image processing |
| US9235909B2 (en) | 2008-05-06 | 2016-01-12 | International Business Machines Corporation | Simplifying the presentation of a visually complex semantic model within a graphical modeling application |
| US9280335B2 (en) | 2010-09-30 | 2016-03-08 | International Business Machines Corporation | Semantically rich composable software image bundles |
| US9286514B1 (en) | 2013-10-17 | 2016-03-15 | United Services Automobile Association (Usaa) | Character count determination for a digital image |
| US9311634B1 (en) | 2008-09-30 | 2016-04-12 | United Services Automobile Association (Usaa) | Systems and methods for automatic bill pay enrollment |
| US9501586B2 (en) | 2013-02-27 | 2016-11-22 | Lenovo Enterprise Solutions (Singapore) Pte. Ltd. | Displaying data sets across a plurality of views of a user interface |
| US9576593B2 (en) | 2012-03-15 | 2017-02-21 | Regents Of The University Of Minnesota | Automated verbal fluency assessment |
| US9779392B1 (en) | 2009-08-19 | 2017-10-03 | United Services Automobile Association (Usaa) | Apparatuses, methods and systems for a publishing and subscribing platform of depositing negotiable instruments |
| US9779082B2 (en) | 2008-01-02 | 2017-10-03 | True Engineering Technology, Llc | Portable self-describing representations of measurements |
| US9807145B2 (en) | 2013-05-10 | 2017-10-31 | Successfactors, Inc. | Adaptive tile framework |
| US9892454B1 (en) | 2007-10-23 | 2018-02-13 | United Services Automobile Association (Usaa) | Systems and methods for obtaining an image of a check to be deposited |
| US9898778B1 (en) | 2007-10-23 | 2018-02-20 | United Services Automobile Association (Usaa) | Systems and methods for obtaining an image of a check to be deposited |
| US10133953B2 (en) * | 2017-01-26 | 2018-11-20 | Nice Ltd. | System and method for enabling graphic-based interoperability with a run-time application |
| US10302741B2 (en) * | 2015-04-02 | 2019-05-28 | Texas Instruments Incorporated | Method and apparatus for live-object detection |
| US10354235B1 (en) | 2007-09-28 | 2019-07-16 | United Services Automoblie Association (USAA) | Systems and methods for digital signature detection |
| US10380565B1 (en) | 2012-01-05 | 2019-08-13 | United Services Automobile Association (Usaa) | System and method for storefront bank deposits |
| US10380562B1 (en) | 2008-02-07 | 2019-08-13 | United Services Automobile Association (Usaa) | Systems and methods for mobile deposit of negotiable instruments |
| US10380559B1 (en) | 2007-03-15 | 2019-08-13 | United Services Automobile Association (Usaa) | Systems and methods for check representment prevention |
| US10402790B1 (en) | 2015-05-28 | 2019-09-03 | United Services Automobile Association (Usaa) | Composing a focused document image from multiple image captures or portions of multiple image captures |
| US10410178B2 (en) | 2015-03-16 | 2019-09-10 | Moca Systems, Inc. | Method for graphical pull planning with active work schedules |
| US10475117B2 (en) | 2001-03-15 | 2019-11-12 | Versata Development Group, Inc. | Method and apparatus for processing sales transaction data |
| US10504185B1 (en) | 2008-09-08 | 2019-12-10 | United Services Automobile Association (Usaa) | Systems and methods for live video financial deposit |
| US10521781B1 (en) | 2003-10-30 | 2019-12-31 | United Services Automobile Association (Usaa) | Wireless electronic check deposit scanning and cashing machine with webbased online account cash management computer application system |
| US10540167B2 (en) | 2017-01-26 | 2020-01-21 | Nice Ltd. | Image based method and system for building object model and application states comparison and graphic-based interoperability with an application |
| US10542961B2 (en) | 2015-06-15 | 2020-01-28 | The Research Foundation For The State University Of New York | System and method for infrasonic cardiac monitoring |
| US10552810B1 (en) | 2012-12-19 | 2020-02-04 | United Services Automobile Association (Usaa) | System and method for remote deposit of financial instruments |
| US10677948B2 (en) | 2016-03-04 | 2020-06-09 | General Electric Company | Context based bounded hydrocarbon formation identification |
| US10740123B2 (en) | 2017-01-26 | 2020-08-11 | Nice Ltd. | Method and system for accessing table content in a digital image of the table |
| US20210064825A1 (en) * | 2018-02-07 | 2021-03-04 | Nec Corporation | Information processing apparatus, information processing method, and computer-readable recording medium |
| US10956728B1 (en) | 2009-03-04 | 2021-03-23 | United Services Automobile Association (Usaa) | Systems and methods of check processing with background removal |
| US11030752B1 (en) | 2018-04-27 | 2021-06-08 | United Services Automobile Association (Usaa) | System, computing device, and method for document detection |
| CN113076661A (en) * | 2021-04-28 | 2021-07-06 | 中国人民解放军国防科技大学 | Uncertain data driven radar early warning detection modeling method |
| US11138578B1 (en) | 2013-09-09 | 2021-10-05 | United Services Automobile Association (Usaa) | Systems and methods for remote deposit of currency |
| CN113904348A (en) * | 2021-10-22 | 2022-01-07 | 三峡大学 | Multi-microgrid low-frequency load shedding control method with self-adaptive variation capability |
| US20230051136A1 (en) * | 2021-08-10 | 2023-02-16 | Palo Alto Research Center Incorporated | Controlling mechanical systems based on natural language input |
| US11790110B2 (en) | 2021-02-09 | 2023-10-17 | Nice Ltd. | System and method for preventing sensitive information from being recorded |
| US11900755B1 (en) | 2020-11-30 | 2024-02-13 | United Services Automobile Association (Usaa) | System, computing device, and method for document detection and deposit processing |
Families Citing this family (3)
| Publication number | Priority date | Publication date | Assignee | Title |
|---|---|---|---|---|
| US7149679B2 (en) | 2003-12-12 | 2006-12-12 | Expand, Inc. | Complex process modeling and simulation system and method |
| JP2017059922A (en) * | 2015-09-15 | 2017-03-23 | 株式会社リコー | Information processing system, image generation device, program, and information processing method |
| CN113780656B (en) * | 2021-09-09 | 2023-09-22 | 中国矿业大学 | Complex product multi-source change propagation influence prediction method based on cluster decoupling |
Citations (10)
| Publication number | Priority date | Publication date | Assignee | Title |
|---|---|---|---|---|
| US5355318A (en) * | 1992-06-02 | 1994-10-11 | Alcatel Alsthom Compagnie Generale D'electricite | Method of manufacturing a fractal object by using steriolithography and a fractal object obtained by performing such a method |
| US5487144A (en) * | 1992-12-01 | 1996-01-23 | Yokogawa Electric Corporation | Scheduling system |
| US5613124A (en) * | 1994-04-15 | 1997-03-18 | Microsoft Corporation | Method and system for generating and storing multiple representations of a source object in object storage |
| US5841437A (en) * | 1993-07-21 | 1998-11-24 | Xerox Corporation | Method and apparatus for interactive database queries via movable viewing operation regions |
| US5917730A (en) * | 1995-08-17 | 1999-06-29 | Gse Process Solutions, Inc. | Computer implemented object oriented visualization system and method |
| US5961599A (en) * | 1996-10-15 | 1999-10-05 | Lucent Technologies Inc. | Apparatus and method for computing the processing delay of adaptive applications network terminals and applications thereof |
| US5963447A (en) * | 1997-08-22 | 1999-10-05 | Hynomics Corporation | Multiple-agent hybrid control architecture for intelligent real-time control of distributed nonlinear processes |
| US6088689A (en) * | 1995-11-29 | 2000-07-11 | Hynomics Corporation | Multiple-agent hybrid control architecture for intelligent real-time control of distributed nonlinear processes |
| US6097212A (en) * | 1997-10-09 | 2000-08-01 | Lattice Semiconductor Corporation | Variable grain architecture for FPGA integrated circuits |
| US6219440B1 (en) * | 1997-01-17 | 2001-04-17 | The University Of Connecticut | Method and apparatus for modeling cellular structure and function |
-
1999
- 1999-04-25 US US09/299,235 patent/US6789054B1/en not_active Expired - Fee Related
-
2000
- 2000-04-24 WO PCT/US2000/010992 patent/WO2000065488A1/en active Application Filing
Patent Citations (10)
| Publication number | Priority date | Publication date | Assignee | Title |
|---|---|---|---|---|
| US5355318A (en) * | 1992-06-02 | 1994-10-11 | Alcatel Alsthom Compagnie Generale D'electricite | Method of manufacturing a fractal object by using steriolithography and a fractal object obtained by performing such a method |
| US5487144A (en) * | 1992-12-01 | 1996-01-23 | Yokogawa Electric Corporation | Scheduling system |
| US5841437A (en) * | 1993-07-21 | 1998-11-24 | Xerox Corporation | Method and apparatus for interactive database queries via movable viewing operation regions |
| US5613124A (en) * | 1994-04-15 | 1997-03-18 | Microsoft Corporation | Method and system for generating and storing multiple representations of a source object in object storage |
| US5917730A (en) * | 1995-08-17 | 1999-06-29 | Gse Process Solutions, Inc. | Computer implemented object oriented visualization system and method |
| US6088689A (en) * | 1995-11-29 | 2000-07-11 | Hynomics Corporation | Multiple-agent hybrid control architecture for intelligent real-time control of distributed nonlinear processes |
| US5961599A (en) * | 1996-10-15 | 1999-10-05 | Lucent Technologies Inc. | Apparatus and method for computing the processing delay of adaptive applications network terminals and applications thereof |
| US6219440B1 (en) * | 1997-01-17 | 2001-04-17 | The University Of Connecticut | Method and apparatus for modeling cellular structure and function |
| US5963447A (en) * | 1997-08-22 | 1999-10-05 | Hynomics Corporation | Multiple-agent hybrid control architecture for intelligent real-time control of distributed nonlinear processes |
| US6097212A (en) * | 1997-10-09 | 2000-08-01 | Lattice Semiconductor Corporation | Variable grain architecture for FPGA integrated circuits |
Non-Patent Citations (20)
| Title |
|---|
| Albus, J. S., Quintero, R., 1990, "Toward a Reference Model Architecture for Real-Time Intelligent Control System", Proceeding of the Workshop on Software Tools for Distributed Intelligent Control Systems, Pacifica, California. |
| Anisaklis, P.J., Passinio, K.M., Wang, S.J. 1989, "Toward Intelligent Autonomous Control Systems:Architecture and Fundamental Issues", Journal of Intelligent and Robotic Systems, 1, 315-342. |
| Athans, M., Apr., 1987, "Command and Control Theory: A Challenge to Control Science", IEEE Transactions on Automatic Control, vol. 32, No. 4. |
| Brooks, F.P., 1987, "Essence and Accidents of Software Engineering", Computer. |
| Champeaux,D., Faure, P., 1992, "A Comparative study of Object-Oriented Analysis Methods", JOOP. |
| Clarke, D.W., 1969,"Generalized Least Square Estimation of the Parameters of a Dynamic Model", National Physics Laboratory Report AUTO 26. |
| Desmond, J.P., 1999, "Modeling for the Masses", Component Strategies. |
| Eric Blough, Michael Eisenberg "Combining Programming Languages and Direct Manipulation in Environments for Computational Science", ACM 1995, pp. 123-130.* * |
| Godfrey, K.R., 1969, "Dynamic Analysis of an Oil Refinery Unit under Nornal Operating Conditions", Proc. IEEE, 116, pp. 879-892. |
| J. Liang et al., Fast Neural Learning and Control of Discrete-Time Nonlinear Systems, IEEE Transactions on Systems, Man, and Cybernetics, vol. 25, No. 3, Mar. 1995, pp. 478-488.* * |
| Joseph Gil, Stuart Kent, "Three Dimensional Software Modelling" IEEE 1998, pp. 105-114.* * |
| Makhoul, J., Apr. 1975, "Linear Prediction, A Tutorial Review" Proc.IEEE, vol. 63, No. 4, pp. 561-580. |
| Makhoul, J., Oct. 1977,"Stable and Efficient Lattice Methods for Linear Prediction", IEEE Transactions on Accoustics, Speech and Signal Processing, vol. ASSP-26, pp. 423-428. |
| Makhoul, J.,Aug. 1978,"A Class of All Zero Lattice Digital Filters: Properties and Applications", IEEE Transactions on Accoustics, Speech and Signal Processing, vol. ASSP-26, No. 4, pp. 304-314. |
| Messershmitt, D.G., Apr. 1980, "A Class of Generalized Lattice Filters", IEEE Transactions on Accoustics, Speech and Signal Processing, vol. ASSP-28, No. 2, pp. 198-204. |
| Nancy Miller, Beth Hetzler, Grant Nakamura, Paul Whitney "The Need For Metrics In Visual Information Analysis", ACM 1998, pp. 24-28.* * |
| Paul G. Bassett, "The Theory and Practice of Adapted Reuse", ACM 1997, pp. 2-9.* * |
| Saridis, G.N., 1989 "Analytical Formulation of the Principle of Increasing Precision with Decreasing Intelligence for Intelligent Machines", Automaticsa vol. 25, No. 3, 461-467. |
| Singh, M.G., Hindi, K., 1991, "A Multilevel Multilayer Framework of Control", Journal of Intelligent and Robotic Systems, 4, 75-93. |
| Varaiya, P., Feb. 1993,"Smart Cars on Smart Roads: Problems of Control", IEEE Transactions on Automatic Control, vol. 38, No 2. |
Cited By (414)
| Publication number | Priority date | Publication date | Assignee | Title |
|---|---|---|---|---|
| US20020188436A1 (en) * | 1998-02-10 | 2002-12-12 | Gunter Schmidt | Nth- order fractal network for handling complex structures |
| US6937968B1 (en) * | 1999-01-21 | 2005-08-30 | Analytical Graphics, Inc. | Method and apparatus for sequentially profiling and solving problems in space mission analysis |
| US7689629B1 (en) | 1999-03-30 | 2010-03-30 | Definiens Ag | Method of the use of fractal semantic networks for all types of database applications |
| US7523079B2 (en) | 1999-04-19 | 2009-04-21 | Definiens Ag | Situation dependent operation of a semantic network machine |
| US20060195407A1 (en) * | 1999-04-19 | 2006-08-31 | Definiens Ag | Situation dependent operation of a semantic network machine |
| US8225271B2 (en) * | 1999-05-17 | 2012-07-17 | Invensys Systems, Inc. | Apparatus for control systems with objects that are associated with live data |
| US8229579B2 (en) | 1999-05-17 | 2012-07-24 | Invensys Systems, Inc. | Control systems and methods with versioning |
| US8060862B2 (en) | 1999-05-17 | 2011-11-15 | Invensys Systems, Inc. | Apparatus and method for configuring a process control system having one or more digital data processors |
| US8056056B2 (en) | 1999-05-17 | 2011-11-08 | Invensys Systems, Inc. | Methods and apparatus for configuring a process control system with a configuration editor executing on a digital data processing device |
| US8028272B2 (en) | 1999-05-17 | 2011-09-27 | Invensys Systems, Inc. | Control system configurator and methods with edit selection |
| US8368640B2 (en) | 1999-05-17 | 2013-02-05 | Invensys Systems, Inc. | Process control configuration system with connection validation and configuration |
| US8090452B2 (en) | 1999-06-11 | 2012-01-03 | Invensys Systems, Inc. | Methods and apparatus for control using control devices that provide a virtual machine environment and that communicate via an IP network |
| US20090268628A1 (en) * | 1999-08-19 | 2009-10-29 | Massachusetts Institute Of Technology | Synchronous Circuit Synthesis Using An Asynchronous Specification |
| US8108810B2 (en) * | 1999-08-19 | 2012-01-31 | Massachusetts Institute Of Technology | Synchronous circuit synthesis using an asynchronous specification |
| US7043698B2 (en) | 1999-09-22 | 2006-05-09 | International Business Machines Corporation | Method and system for profiling users based on their relationships with content topics |
| US20020087600A1 (en) * | 1999-09-22 | 2002-07-04 | Newbold David Leroy | Method and system for profiling users based on their relationships with content topics |
| US20020019797A1 (en) * | 2000-02-16 | 2002-02-14 | Rocky Stewart | Message routing system for enterprise wide electronic collaboration |
| US7418475B2 (en) | 2000-02-16 | 2008-08-26 | Bea Systems, Inc. | Conversation management system for enterprise wide electronic collaboration |
| US8321313B2 (en) * | 2000-03-06 | 2012-11-27 | Wellogix Technology Licensing, Llc | Method and process for providing relevant data, comparing proposal alternatives, and reconciling proposals, invoices, and purchase orders with actual costs in a workflow process |
| US20080065445A1 (en) * | 2000-03-06 | 2008-03-13 | Livesay Jeffrey A | Method and process for providing relevant data, comparing proposal alternatives, and reconciling proposals, invoices, and purchase orders with actual costs in a workflow process |
| US20140258047A1 (en) * | 2000-03-06 | 2014-09-11 | Wellogix Technology Licensing, Llc | Method and process for providing relevant data, comparing proposal alternatives, and reconciling proposals; invoices, and purchase orders with actual costs in a workflow process |
| US20140040077A1 (en) * | 2000-03-06 | 2014-02-06 | Wellogix Technology Licensing, Llc | Method and process for providing relevant data, comparing proposal alternatives, and reconciling proposals; invoices, and purchase orders with actual costs in a workflow process |
| US20040032700A1 (en) * | 2000-06-20 | 2004-02-19 | Noriaki Matsuno | Base bias circuit, and power amplifier using the base bias circuit |
| US7636708B2 (en) * | 2000-11-10 | 2009-12-22 | Microsoft Corporation | Distributed data gathering and aggregation agent |
| US20050021546A1 (en) * | 2000-11-10 | 2005-01-27 | Microsoft Corporation | Distributed data gathering and aggregation agent |
| US20050027727A1 (en) * | 2000-11-10 | 2005-02-03 | Microsoft Corporation | Distributed data gathering and aggregation agent |
| US7640258B2 (en) | 2000-11-10 | 2009-12-29 | Microsoft Corporation | Distributed data gathering and aggregation agent |
| US7480647B1 (en) | 2000-12-05 | 2009-01-20 | Microsoft Corporation | Performance logging solution |
| US20050149909A1 (en) * | 2001-01-23 | 2005-07-07 | Batcha Thomas R. | System and method of designing, testing, and employing graphical computer code |
| US20020129082A1 (en) * | 2001-03-08 | 2002-09-12 | International Business Machines Corporation | Inter-partition message passing method, system and program product for throughput measurement in a partitioned processing environment |
| US7089558B2 (en) * | 2001-03-08 | 2006-08-08 | International Business Machines Corporation | Inter-partition message passing method, system and program product for throughput measurement in a partitioned processing environment |
| US20110125635A1 (en) * | 2001-03-15 | 2011-05-26 | David Chao | Method and system for managing distributor information |
| US9076127B2 (en) | 2001-03-15 | 2015-07-07 | Versata Development Group, Inc. | Method and system for managing distributor information |
| US20110231197A1 (en) * | 2001-03-15 | 2011-09-22 | David Chao | Framework for processing sales transaction data |
| US10475117B2 (en) | 2001-03-15 | 2019-11-12 | Versata Development Group, Inc. | Method and apparatus for processing sales transaction data |
| US9058610B2 (en) | 2001-06-29 | 2015-06-16 | Versata Development Group, Inc. | Method and apparatus for performing collective validation of credential information |
| US20110131137A1 (en) * | 2001-06-29 | 2011-06-02 | Shari Gharavy | Method and apparatus for performing collective validation of credential information |
| US7076779B2 (en) * | 2001-07-19 | 2006-07-11 | Oce Technologies B.V. | System for controlling and monitoring a process |
| US20030018402A1 (en) * | 2001-07-19 | 2003-01-23 | Breunese Arno Pieter Jan | System for controlling and monitoring a process |
| AU2002300038B2 (en) * | 2001-07-19 | 2007-11-01 | Oce-Technologies B.V. | System for controlling and monitoring a process |
| US7546462B2 (en) | 2001-10-18 | 2009-06-09 | Bea Systems, Inc. | Systems and methods for integration adapter security |
| US7546606B2 (en) | 2001-10-18 | 2009-06-09 | Bea Systems, Inc. | System and method using a connector architecture for application integration |
| US20030105884A1 (en) * | 2001-10-18 | 2003-06-05 | Mitch Upton | System and method for using Web services with an enterprise system |
| US7721193B2 (en) | 2001-10-18 | 2010-05-18 | Bea Systems, Inc. | System and method for implementing a schema object model in application integration |
| US7552443B2 (en) | 2001-10-18 | 2009-06-23 | Bea Systems, Inc. | System and method for implementing an event adapter |
| US7831655B2 (en) | 2001-10-18 | 2010-11-09 | Bea Systems, Inc. | System and method for implementing a service adapter |
| US7516440B2 (en) | 2001-10-18 | 2009-04-07 | Bea Systems, Inc. | System and method for providing a java interface to an application view component |
| US7552222B2 (en) | 2001-10-18 | 2009-06-23 | Bea Systems, Inc. | Single system user identity |
| US20030110315A1 (en) * | 2001-10-18 | 2003-06-12 | Mitch Upton | System and method for providing a java interface to an application view component |
| US20030084228A1 (en) * | 2001-10-31 | 2003-05-01 | Bernard Hautbergue | Parametring and automatic compilation of structures using standard representation networks |
| US20030135489A1 (en) * | 2002-01-14 | 2003-07-17 | Goodwin James Patrick | System and method for processing data in a distributed architecture |
| US7249034B2 (en) | 2002-01-14 | 2007-07-24 | International Business Machines Corporation | System and method for publishing a person's affinities |
| US7124353B2 (en) | 2002-01-14 | 2006-10-17 | International Business Machines Corporation | System and method for calculating a user affinity |
| US9159048B2 (en) | 2002-01-14 | 2015-10-13 | International Business Machines Corporation | Knowledge gathering system based on user's affinity |
| US7200592B2 (en) | 2002-01-14 | 2007-04-03 | International Business Machines Corporation | System for synchronizing of user's affinity to knowledge |
| US7209906B2 (en) * | 2002-01-14 | 2007-04-24 | International Business Machines Corporation | System and method for implementing a metrics engine for tracking relationships over time |
| US11809432B2 (en) | 2002-01-14 | 2023-11-07 | Awemane Ltd. | Knowledge gathering system based on user's affinity |
| US20030154196A1 (en) * | 2002-01-14 | 2003-08-14 | Goodwin James P. | System for organizing knowledge data and communication with users having affinity to knowledge data |
| US7219098B2 (en) | 2002-01-14 | 2007-05-15 | International Business Machines Corporation | System and method for processing data in a distributed architecture |
| US7222297B2 (en) | 2002-01-14 | 2007-05-22 | International Business Machines Corporation | System and method for using XML to normalize documents |
| US20030177127A1 (en) * | 2002-01-14 | 2003-09-18 | Goodwin James P | System and method for distributing services for knowledge management processing |
| US20030158866A1 (en) * | 2002-01-14 | 2003-08-21 | Goodwin James P. | System for categorizing and normalizing knowledge data based on user's affinity to knowledge |
| US20030135606A1 (en) * | 2002-01-14 | 2003-07-17 | Goodwin James Patrick | System and method for implementing a metrics engine for tracking relationships over time |
| US20030154186A1 (en) * | 2002-01-14 | 2003-08-14 | Goodwin James P. | System for synchronizing of user's affinity to knowledge |
| US7698303B2 (en) | 2002-01-14 | 2010-04-13 | International Business Machines Corporation | System for categorizing and normalizing knowledge data based on user's affinity to knowledge |
| US8195671B2 (en) | 2002-01-14 | 2012-06-05 | International Business Machines Corporation | Method for distributing services for knowledge management processing |
| US7698255B2 (en) | 2002-01-14 | 2010-04-13 | International Business Machines Corporation | System for organizing knowledge data and communication with users having affinity to knowledge data |
| US20030163485A1 (en) * | 2002-01-14 | 2003-08-28 | Goodwin James P. | Knowledge gathering system based on user's affinity |
| US20030158867A1 (en) * | 2002-01-14 | 2003-08-21 | Goodwin James P. | System and method for mapping knowledge data based on user's affinity to knowledge |
| US20030135379A1 (en) * | 2002-01-14 | 2003-07-17 | Schirmer Andrew Lewis | System and method for publishing a person's affinities |
| US8015572B2 (en) | 2002-02-22 | 2011-09-06 | Oracle International Corporation | Systems and methods for an extensible software proxy |
| US8484664B2 (en) | 2002-02-22 | 2013-07-09 | Oracle International Corporation | Systems and methods for an extensible software proxy |
| US20050149308A1 (en) * | 2002-04-09 | 2005-07-07 | Commissariat A L'energie Atomoque | Biscuit product that can be used to improve nutritional prevention of the harmful effects associated with oxidative stress |
| US7499843B2 (en) * | 2002-04-09 | 2009-03-03 | Commissariat A L'energie Atomique | Reconfigurable control system based on hardware implementation of Petri graphs |
| US7840611B2 (en) | 2002-05-01 | 2010-11-23 | Oracle International Corporation | High availability for event forwarding |
| US7840532B2 (en) | 2002-05-01 | 2010-11-23 | Oracle International Corporation | System and method for storing large messages |
| US7424717B2 (en) | 2002-05-01 | 2008-09-09 | Bea Systems, Inc. | Systems and methods for business process plug-in development |
| US8135772B2 (en) | 2002-05-01 | 2012-03-13 | Oracle International Corporation | Single servlets for B2B message routing |
| US20040078440A1 (en) * | 2002-05-01 | 2004-04-22 | Tim Potter | High availability event topic |
| US7519976B2 (en) | 2002-05-01 | 2009-04-14 | Bea Systems, Inc. | Collaborative business plug-in framework |
| US20070198467A1 (en) * | 2002-05-01 | 2007-08-23 | Bea Systems, Inc. | System and method for storing large messages |
| US7493628B2 (en) | 2002-05-02 | 2009-02-17 | Bea Systems, Inc. | Shared common connection factory |
| US7484224B2 (en) | 2002-05-02 | 2009-01-27 | Bae Systems, Inc. | Adapter deployment without recycle |
| US7627631B2 (en) | 2002-05-02 | 2009-12-01 | Bea Systems, Inc. | Systems and methods for collaborative business plug-ins |
| US7676538B2 (en) | 2002-05-02 | 2010-03-09 | Bea Systems, Inc. | Systems and methods for application view transactions |
| US7953787B2 (en) | 2002-05-02 | 2011-05-31 | Oracle International Corporation | System and method for providing highly available processing of asynchronous requests using distributed request and response queues and a service processor |
| US7162405B2 (en) * | 2002-05-31 | 2007-01-09 | Certalogic, Inc. | Method for modeling and viewing real world objects in a network model at real world times |
| US20040054508A1 (en) * | 2002-05-31 | 2004-03-18 | Mc Cabe Alejandro Javier Spiritoso | Method for modeling and viewing real world objects in a network model at real world times |
| US20040122534A1 (en) * | 2002-08-30 | 2004-06-24 | Paulin Matthew A. | Method for facilitating computer-based modeling |
| US7174284B2 (en) * | 2002-10-21 | 2007-02-06 | Siemens Aktiengesellschaft | Apparatus and method for simulation of the control and machine behavior of machine tools and production-line machines |
| US20050090929A1 (en) * | 2002-10-21 | 2005-04-28 | Siemens Aktiengesellschaft | Apparatus and method for simulation of the control and machine behavior of machine tools and production-line machines |
| US20040122950A1 (en) * | 2002-12-20 | 2004-06-24 | Morgan Stephen Paul | Method for managing workloads in an autonomic computer system for improved performance |
| US20090287321A1 (en) * | 2003-02-18 | 2009-11-19 | Fisher-Rosemount Systems, Inc. | Configuration system using security objects in a process plant |
| US7971052B2 (en) * | 2003-02-18 | 2011-06-28 | Fisher-Rosemount Systems, Inc. | Configuration system using security objects in a process plant |
| US7774697B2 (en) | 2003-02-25 | 2010-08-10 | Bea Systems, Inc. | System and method for structuring distributed applications |
| US7584474B2 (en) | 2003-02-25 | 2009-09-01 | Bea Systems, Inc. | Systems and methods for transaction chaining |
| US7844636B2 (en) | 2003-02-25 | 2010-11-30 | Oracle International Corporation | Systems and methods for client-side filtering of subscribed messages |
| US20040187127A1 (en) * | 2003-02-25 | 2004-09-23 | Albert Gondi | Systems and methods for transaction chaining |
| US20040167915A1 (en) * | 2003-02-25 | 2004-08-26 | Bea Systems, Inc. | Systems and methods for declaratively transforming data objects between disparate representations |
| US7752599B2 (en) | 2003-02-25 | 2010-07-06 | Bea Systems Inc. | Systems and methods extending an existing programming language with constructs |
| US20050108682A1 (en) * | 2003-02-26 | 2005-05-19 | Bea Systems, Inc. | Systems for type-independent source code editing |
| US20050114771A1 (en) * | 2003-02-26 | 2005-05-26 | Bea Systems, Inc. | Methods for type-independent source code editing |
| US20050034104A1 (en) * | 2003-02-26 | 2005-02-10 | Bea Systems, Inc. | Method for multi-language debugging |
| US7650276B2 (en) | 2003-02-26 | 2010-01-19 | Bea Systems, Inc. | System and method for dynamic data binding in distributed applications |
| US8032860B2 (en) | 2003-02-26 | 2011-10-04 | Oracle International Corporation | Methods for type-independent source code editing |
| US7539985B2 (en) | 2003-02-26 | 2009-05-26 | Bea Systems, Inc. | Systems and methods for dynamic component versioning |
| US7299454B2 (en) | 2003-02-26 | 2007-11-20 | Bea Systems, Inc. | Method for multi-language debugging |
| US7707564B2 (en) | 2003-02-26 | 2010-04-27 | Bea Systems, Inc. | Systems and methods for creating network-based software services using source code annotations |
| US7441238B2 (en) | 2003-02-26 | 2008-10-21 | Bea Systems, Inc. | Extendable compiler framework |
| US7444620B2 (en) | 2003-02-28 | 2008-10-28 | Bea Systems, Inc. | Systems and methods for a common runtime container framework |
| USRE44964E1 (en) * | 2003-02-28 | 2014-06-24 | Omnex Systems L.L.C. | Quality information management system |
| US20040225995A1 (en) * | 2003-02-28 | 2004-11-11 | Kyle Marvin | Reusable software controls |
| US7636722B2 (en) | 2003-02-28 | 2009-12-22 | Bea Systems, Inc. | System and method for describing application extensions in XML |
| US20040172618A1 (en) * | 2003-02-28 | 2004-09-02 | Bea Systems, Inc. | Systems and methods for a common runtime container framework |
| US7650592B2 (en) | 2003-03-01 | 2010-01-19 | Bea Systems, Inc. | Systems and methods for multi-view debugging environment |
| US7428519B2 (en) * | 2003-06-04 | 2008-09-23 | Steven Minsky | Relational logic management system |
| US20110054970A1 (en) * | 2003-06-04 | 2011-03-03 | Steven Minsky | Relational logic management system |
| US20090106063A1 (en) * | 2003-06-04 | 2009-04-23 | Steven Minsky | Relational logic management system |
| US20050038764A1 (en) * | 2003-06-04 | 2005-02-17 | Steven Minsky | Relational logic management system |
| US7835932B2 (en) | 2003-06-04 | 2010-11-16 | Fair Isaac Corporation | Relational logic management system |
| US7720857B2 (en) * | 2003-08-29 | 2010-05-18 | Sap Ag | Method and system for providing an invisible attractor in a predetermined sector, which attracts a subset of entities depending on an entity type |
| US20050114384A1 (en) * | 2003-08-29 | 2005-05-26 | Joerg Beringer | Methods and systems for providing a visualization graph |
| US10521781B1 (en) | 2003-10-30 | 2019-12-31 | United Services Automobile Association (Usaa) | Wireless electronic check deposit scanning and cashing machine with webbased online account cash management computer application system |
| US11200550B1 (en) | 2003-10-30 | 2021-12-14 | United Services Automobile Association (Usaa) | Wireless electronic check deposit scanning and cashing machine with web-based online account cash management computer application system |
| US8010333B2 (en) * | 2003-11-19 | 2011-08-30 | Schneider Electric Gmbh | Process for developing and implementing a model for the formal description of a collaborative system comprised of multiple distributed components, especially an intelligent, flexible production and/or process automation system |
| US20060015315A1 (en) * | 2003-11-19 | 2006-01-19 | Schneider Electric Gmbh | Process for developing and implementing a model for the formal description of a collaborative system comprised of multiple distributed components, especially an intelligent, flexible production and/or process automation system |
| US9288000B2 (en) | 2003-12-17 | 2016-03-15 | International Business Machines Corporation | Monitoring a communication and retrieving information relevant to the communication |
| US9875308B2 (en) | 2003-12-17 | 2018-01-23 | International Business Machines Corporation | Monitoring a communication and retrieving information relevant to the communication |
| US20050160166A1 (en) * | 2003-12-17 | 2005-07-21 | Kraenzel Carl J. | System and method for monitoring a communication and retrieving information relevant to the communication |
| US7694250B2 (en) * | 2004-01-13 | 2010-04-06 | Renault Sas | Method for design and verification of safety critical systems |
| US20070168096A1 (en) * | 2004-01-13 | 2007-07-19 | Renault S.A.S. | Design of safety critical systems |
| US20070180424A1 (en) * | 2004-03-02 | 2007-08-02 | Evgeny Kazakov | Device, system and method for accelerated modeling |
| US7823120B2 (en) * | 2004-03-02 | 2010-10-26 | Metaphor Vision Ltd. | Device, system and method for accelerated modeling |
| US20060080369A1 (en) * | 2004-03-04 | 2006-04-13 | Mathsoft Engineering & Education, Inc. | Method for automatically enabling traceability of engineering calculations |
| US8121998B2 (en) * | 2004-03-04 | 2012-02-21 | Parametric Technology Corporation | Method for automatically enabling traceability of engineering calculations |
| US20050267731A1 (en) * | 2004-05-27 | 2005-12-01 | Robert Allen Hatcherson | Container-based architecture for simulation of entities in a time domain |
| US7516052B2 (en) * | 2004-05-27 | 2009-04-07 | Robert Allen Hatcherson | Container-based architecture for simulation of entities in a time domain |
| US20080263480A1 (en) * | 2004-06-03 | 2008-10-23 | Lsi Corporation | Language and templates for use in the design of semiconductor products |
| US20050273736A1 (en) * | 2004-06-03 | 2005-12-08 | Lsi Logic Corporation | Rules and directives for validating correct data used in the design of semiconductor products |
| US7945878B2 (en) | 2004-06-03 | 2011-05-17 | Lsi Corporation | Rules and directives for validating correct data used in the design of semiconductor products |
| US20090077510A1 (en) * | 2004-06-03 | 2009-03-19 | Todd Jason Youngman | Rules and directives for validating correct data used in the design of semiconductor products |
| US8037448B2 (en) | 2004-06-03 | 2011-10-11 | Lsi Corporation | Language and templates for use in the design of semiconductor products |
| US7398492B2 (en) * | 2004-06-03 | 2008-07-08 | Lsi Corporation | Rules and directives for validating correct data used in the design of semiconductor products |
| US7930678B2 (en) * | 2004-06-30 | 2011-04-19 | International Business Machines Corporation | Visualizing and modeling interaction relationships among entities |
| US20060004872A1 (en) * | 2004-06-30 | 2006-01-05 | International Business Machines Corporation | Visualizing and modeling interaction relationship among entities |
| US7640521B2 (en) * | 2004-07-01 | 2009-12-29 | Fujitsu Limited | Model verification support method, apparatus, and computer-readable recording medium storing program |
| US20070106490A1 (en) * | 2004-07-01 | 2007-05-10 | Fujitsu Limited | Verification support method, verification supporting apparatus, and computer product |
| US7877737B2 (en) * | 2004-07-23 | 2011-01-25 | University Of Maryland | Tree-to-graph folding procedure for systems engineering requirements |
| US20060037019A1 (en) * | 2004-07-23 | 2006-02-16 | Austin Mark A | Tree-to-graph folding procedure for systems engineering requirements |
| US20060149731A1 (en) * | 2005-01-05 | 2006-07-06 | Schirmer Andrew L | System and method for deriving affinity relationships between objects |
| US7779053B2 (en) * | 2005-03-17 | 2010-08-17 | Siemens Aktiengesellschaft | Diagnosis of an automation system |
| US20060212268A1 (en) * | 2005-03-17 | 2006-09-21 | Hans-Joachim Beck | Diagnosis of an automation system |
| US7752017B1 (en) * | 2005-03-24 | 2010-07-06 | Moca Systems, Inc. | System and method for simulating resource allocation |
| US20110078652A1 (en) * | 2005-05-31 | 2011-03-31 | The Mathworks, Inc. | Graphical partitioning for parallel execution of executable block diagram models |
| US8478577B2 (en) | 2005-05-31 | 2013-07-02 | The Math Works, Inc. | Modeling of a multiprocessor system |
| US20070294074A1 (en) * | 2005-05-31 | 2007-12-20 | The Mathworks, Inc. | Modeling of a multiprocessor system |
| US8447580B2 (en) * | 2005-05-31 | 2013-05-21 | The Mathworks, Inc. | Modeling of a multiprocessor system |
| US20060282252A1 (en) * | 2005-05-31 | 2006-12-14 | The Mathworks, Inc. | Modeling of a multiprocessor system |
| US8756044B2 (en) | 2005-05-31 | 2014-06-17 | The Mathworks, Inc. | Graphical partitioning for parallel execution of executable block diagram models |
| US7580818B2 (en) * | 2005-11-01 | 2009-08-25 | Raytheon Company | Mission profiling |
| US20080015909A1 (en) * | 2005-11-01 | 2008-01-17 | Piali De | Mission profiling |
| US7614035B2 (en) * | 2005-11-04 | 2009-11-03 | Microsoft Corporation | Cartographic software maps |
| US20070106975A1 (en) * | 2005-11-04 | 2007-05-10 | Microsoft Corporation | Cartographic software maps |
| US8209201B1 (en) * | 2005-12-08 | 2012-06-26 | Hewlett-Packard Development Company, L.P. | System and method for correlating objects |
| US8140302B1 (en) * | 2005-12-15 | 2012-03-20 | The Mathworks, Inc. | Method for using variable structure in physical modeling |
| US20070261012A1 (en) * | 2006-03-23 | 2007-11-08 | Fujitsu Limited | Systematic generation of scenarios from specification sheet |
| US7904843B2 (en) * | 2006-03-23 | 2011-03-08 | Fujitsu Limited | Systematic generation of scenarios from specification sheet |
| US20070239505A1 (en) * | 2006-03-30 | 2007-10-11 | Microsoft Corporation | Abstract execution model for a continuation-based meta-runtime |
| US7975257B2 (en) * | 2006-06-13 | 2011-07-05 | Microsoft Corporation | Iterative static and dynamic software analysis |
| US20070288899A1 (en) * | 2006-06-13 | 2007-12-13 | Microsoft Corporation | Iterative static and dynamic software analysis |
| US20080123559A1 (en) * | 2006-08-07 | 2008-05-29 | Voltaire Ltd. | Service-oriented infrastructure management |
| US7822594B2 (en) * | 2006-08-07 | 2010-10-26 | Voltaire Ltd. | Service-oriented infrastructure management |
| US8280716B2 (en) | 2006-08-07 | 2012-10-02 | Voltaire Ltd. | Service-oriented infrastructure management |
| US20110004457A1 (en) * | 2006-08-07 | 2011-01-06 | Voltaire Ltd. | Service-oriented infrastructure management |
| US20100088664A1 (en) * | 2006-08-14 | 2010-04-08 | Payman Khodabandehloo | Design tool and methodology for enterprise software applications |
| US20080040704A1 (en) * | 2006-08-14 | 2008-02-14 | Payman Khodabandehloo | Design tool and methodology for enterprise software applications |
| US7644390B2 (en) | 2006-08-14 | 2010-01-05 | Payman Khodabandehloo | Design tool and methodology for enterprise software applications |
| US8694953B2 (en) | 2006-08-14 | 2014-04-08 | Payman Khodabandehloo | Tool and methodology for enterprise software applications |
| US9374621B2 (en) | 2006-09-07 | 2016-06-21 | Opentv, Inc. | Method and system to navigate viewable content |
| US9860583B2 (en) | 2006-09-07 | 2018-01-02 | Opentv, Inc. | Method and system to navigate viewable content |
| US20110090402A1 (en) * | 2006-09-07 | 2011-04-21 | Matthew Huntington | Method and system to navigate viewable content |
| US11451857B2 (en) | 2006-09-07 | 2022-09-20 | Opentv, Inc. | Method and system to navigate viewable content |
| US8701041B2 (en) * | 2006-09-07 | 2014-04-15 | Opentv, Inc. | Method and system to navigate viewable content |
| US11057665B2 (en) | 2006-09-07 | 2021-07-06 | Opentv, Inc. | Method and system to navigate viewable content |
| US10506277B2 (en) | 2006-09-07 | 2019-12-10 | Opentv, Inc. | Method and system to navigate viewable content |
| US20090262376A1 (en) * | 2006-09-15 | 2009-10-22 | Hideki Aoyama | Grain pattern for grain pattern printing, method and program for creating grain pattern, and housing building material product, automotive interior part, electric home appliance, and information equipment with grain pattern printed thereon |
| US10013605B1 (en) | 2006-10-31 | 2018-07-03 | United Services Automobile Association (Usaa) | Digital camera processing system |
| US8708227B1 (en) | 2006-10-31 | 2014-04-29 | United Services Automobile Association (Usaa) | Systems and methods for remote deposit of checks |
| US10460295B1 (en) | 2006-10-31 | 2019-10-29 | United Services Automobile Association (Usaa) | Systems and methods for remote deposit of checks |
| US10482432B1 (en) | 2006-10-31 | 2019-11-19 | United Services Automobile Association (Usaa) | Systems and methods for remote deposit of checks |
| US10013681B1 (en) | 2006-10-31 | 2018-07-03 | United Services Automobile Association (Usaa) | System and method for mobile check deposit |
| US10621559B1 (en) | 2006-10-31 | 2020-04-14 | United Services Automobile Association (Usaa) | Systems and methods for remote deposit of checks |
| US10719815B1 (en) | 2006-10-31 | 2020-07-21 | United Services Automobile Association (Usaa) | Systems and methods for remote deposit of checks |
| US10769598B1 (en) | 2006-10-31 | 2020-09-08 | United States Automobile (USAA) | Systems and methods for remote deposit of checks |
| US11875314B1 (en) | 2006-10-31 | 2024-01-16 | United Services Automobile Association (Usaa) | Systems and methods for remote deposit of checks |
| US11023719B1 (en) | 2006-10-31 | 2021-06-01 | United Services Automobile Association (Usaa) | Digital camera processing system |
| US9224136B1 (en) | 2006-10-31 | 2015-12-29 | United Services Automobile Association (Usaa) | Systems and methods for remote deposit of checks |
| US11182753B1 (en) | 2006-10-31 | 2021-11-23 | United Services Automobile Association (Usaa) | Systems and methods for remote deposit of checks |
| US11348075B1 (en) | 2006-10-31 | 2022-05-31 | United Services Automobile Association (Usaa) | Systems and methods for remote deposit of checks |
| US8799147B1 (en) | 2006-10-31 | 2014-08-05 | United Services Automobile Association (Usaa) | Systems and methods for remote deposit of negotiable instruments with non-payee institutions |
| US11429949B1 (en) | 2006-10-31 | 2022-08-30 | United Services Automobile Association (Usaa) | Systems and methods for remote deposit of checks |
| US10402638B1 (en) | 2006-10-31 | 2019-09-03 | United Services Automobile Association (Usaa) | Digital camera processing system |
| US11461743B1 (en) | 2006-10-31 | 2022-10-04 | United Services Automobile Association (Usaa) | Systems and methods for remote deposit of checks |
| US11488405B1 (en) | 2006-10-31 | 2022-11-01 | United Services Automobile Association (Usaa) | Systems and methods for remote deposit of checks |
| US11538015B1 (en) | 2006-10-31 | 2022-12-27 | United Services Automobile Association (Usaa) | Systems and methods for remote deposit of checks |
| US11544944B1 (en) | 2006-10-31 | 2023-01-03 | United Services Automobile Association (Usaa) | Digital camera processing system |
| US11562332B1 (en) | 2006-10-31 | 2023-01-24 | United Services Automobile Association (Usaa) | Systems and methods for remote deposit of checks |
| US7873200B1 (en) | 2006-10-31 | 2011-01-18 | United Services Automobile Association (Usaa) | Systems and methods for remote deposit of checks |
| US11625770B1 (en) | 2006-10-31 | 2023-04-11 | United Services Automobile Association (Usaa) | Digital camera processing system |
| US7885451B1 (en) | 2006-10-31 | 2011-02-08 | United Services Automobile Association (Usaa) | Systems and methods for displaying negotiable instruments derived from various sources |
| US8392332B1 (en) | 2006-10-31 | 2013-03-05 | United Services Automobile Association (Usaa) | Systems and methods for remote deposit of checks |
| US11682222B1 (en) | 2006-10-31 | 2023-06-20 | United Services Automobile Associates (USAA) | Digital camera processing system |
| US8351677B1 (en) | 2006-10-31 | 2013-01-08 | United Services Automobile Association (Usaa) | Systems and methods for remote deposit of checks |
| US11682221B1 (en) | 2006-10-31 | 2023-06-20 | United Services Automobile Associates (USAA) | Digital camera processing system |
| US7876949B1 (en) | 2006-10-31 | 2011-01-25 | United Services Automobile Association | Systems and methods for remote deposit of checks |
| US7636697B1 (en) * | 2007-01-29 | 2009-12-22 | Ailive Inc. | Method and system for rapid evaluation of logical expressions |
| US8909722B2 (en) | 2007-03-07 | 2014-12-09 | True Engineering Technology, Llc | System and method of supporting constructive discourse on computers and mobile devices |
| US9276888B2 (en) | 2007-03-07 | 2016-03-01 | True Engineering Technology, Llc | System and method of supporting constructive discourse on computers and mobile devices |
| US10380559B1 (en) | 2007-03-15 | 2019-08-13 | United Services Automobile Association (Usaa) | Systems and methods for check representment prevention |
| US8959033B1 (en) | 2007-03-15 | 2015-02-17 | United Services Automobile Association (Usaa) | Systems and methods for verification of remotely deposited checks |
| US8433127B1 (en) | 2007-05-10 | 2013-04-30 | United Services Automobile Association (Usaa) | Systems and methods for real-time validation of check image quality |
| US8538124B1 (en) | 2007-05-10 | 2013-09-17 | United Services Auto Association (USAA) | Systems and methods for real-time validation of check image quality |
| US20090089121A1 (en) * | 2007-09-27 | 2009-04-02 | Siemens Aktiengesellschaft | Method and system for controlling a project |
| US8417506B2 (en) | 2007-09-28 | 2013-04-09 | Rockwell Automation Technologies, Inc. | Simulation controls for model variablity and randomness |
| US20100318339A1 (en) * | 2007-09-28 | 2010-12-16 | Rockwell Automation Technologies, Inc. | Simulation controls for model variablity and randomness |
| US8548777B2 (en) | 2007-09-28 | 2013-10-01 | Rockwell Automation Technologies, Inc. | Automated recommendations from simulation |
| US20090089031A1 (en) * | 2007-09-28 | 2009-04-02 | Rockwell Automation Technologies, Inc. | Integrated simulation of controllers and devices |
| US11328267B1 (en) | 2007-09-28 | 2022-05-10 | United Services Automobile Association (Usaa) | Systems and methods for digital signature detection |
| US20090089029A1 (en) * | 2007-09-28 | 2009-04-02 | Rockwell Automation Technologies, Inc. | Enhanced execution speed to improve simulation performance |
| US10354235B1 (en) | 2007-09-28 | 2019-07-16 | United Services Automoblie Association (USAA) | Systems and methods for digital signature detection |
| US20090089234A1 (en) * | 2007-09-28 | 2009-04-02 | Rockwell Automation Technologies, Inc. | Automated code generation for simulators |
| US8069021B2 (en) * | 2007-09-28 | 2011-11-29 | Rockwell Automation Technologies, Inc. | Distributed simulation and synchronization |
| US20090089030A1 (en) * | 2007-09-28 | 2009-04-02 | Rockwell Automation Technologies, Inc. | Distributed simulation and synchronization |
| US20090089227A1 (en) * | 2007-09-28 | 2009-04-02 | Rockwell Automation Technologies, Inc. | Automated recommendations from simulation |
| US10713629B1 (en) | 2007-09-28 | 2020-07-14 | United Services Automobile Association (Usaa) | Systems and methods for digital signature detection |
| US20090249129A1 (en) * | 2007-10-12 | 2009-10-01 | David Femia | Systems and Methods for Managing Multi-Component Systems in an Infrastructure |
| US10915879B1 (en) | 2007-10-23 | 2021-02-09 | United Services Automobile Association (Usaa) | Image processing |
| US10373136B1 (en) | 2007-10-23 | 2019-08-06 | United Services Automobile Association (Usaa) | Image processing |
| US10460381B1 (en) | 2007-10-23 | 2019-10-29 | United Services Automobile Association (Usaa) | Systems and methods for obtaining an image of a check to be deposited |
| US9159101B1 (en) | 2007-10-23 | 2015-10-13 | United Services Automobile Association (Usaa) | Image processing |
| US8358826B1 (en) | 2007-10-23 | 2013-01-22 | United Services Automobile Association (Usaa) | Systems and methods for receiving and orienting an image of one or more checks |
| US9892454B1 (en) | 2007-10-23 | 2018-02-13 | United Services Automobile Association (Usaa) | Systems and methods for obtaining an image of a check to be deposited |
| US9898778B1 (en) | 2007-10-23 | 2018-02-20 | United Services Automobile Association (Usaa) | Systems and methods for obtaining an image of a check to be deposited |
| US11392912B1 (en) | 2007-10-23 | 2022-07-19 | United Services Automobile Association (Usaa) | Image processing |
| US10810561B1 (en) | 2007-10-23 | 2020-10-20 | United Services Automobile Association (Usaa) | Image processing |
| US7996316B1 (en) | 2007-10-30 | 2011-08-09 | United Services Automobile Association | Systems and methods to modify a negotiable instrument |
| US8001051B1 (en) | 2007-10-30 | 2011-08-16 | United Services Automobile Association (Usaa) | Systems and methods to modify a negotiable instrument |
| US7996314B1 (en) | 2007-10-30 | 2011-08-09 | United Services Automobile Association (Usaa) | Systems and methods to modify a negotiable instrument |
| US8046301B1 (en) | 2007-10-30 | 2011-10-25 | United Services Automobile Association (Usaa) | Systems and methods to modify a negotiable instrument |
| US7996315B1 (en) | 2007-10-30 | 2011-08-09 | United Services Automobile Association (Usaa) | Systems and methods to modify a negotiable instrument |
| US8290237B1 (en) | 2007-10-31 | 2012-10-16 | United Services Automobile Association (Usaa) | Systems and methods to use a digital camera to remotely deposit a negotiable instrument |
| US8320657B1 (en) | 2007-10-31 | 2012-11-27 | United Services Automobile Association (Usaa) | Systems and methods to use a digital camera to remotely deposit a negotiable instrument |
| US8464933B1 (en) | 2007-11-06 | 2013-06-18 | United Services Automobile Association (Usaa) | Systems, methods and apparatus for receiving images of one or more checks |
| US7896232B1 (en) | 2007-11-06 | 2011-03-01 | United Services Automobile Association (Usaa) | Systems, methods, and apparatus for receiving images of one or more checks |
| US7900822B1 (en) | 2007-11-06 | 2011-03-08 | United Services Automobile Association (Usaa) | Systems, methods, and apparatus for receiving images of one or more checks |
| US7958076B2 (en) | 2007-11-30 | 2011-06-07 | Stratus Technologies Bermuda Ltd. | System and methods for managing rules and detecting reciprocal dependencies |
| US9779082B2 (en) | 2008-01-02 | 2017-10-03 | True Engineering Technology, Llc | Portable self-describing representations of measurements |
| US10839358B1 (en) | 2008-02-07 | 2020-11-17 | United Services Automobile Association (Usaa) | Systems and methods for mobile deposit of negotiable instruments |
| US10380562B1 (en) | 2008-02-07 | 2019-08-13 | United Services Automobile Association (Usaa) | Systems and methods for mobile deposit of negotiable instruments |
| US11531973B1 (en) | 2008-02-07 | 2022-12-20 | United Services Automobile Association (Usaa) | Systems and methods for mobile deposit of negotiable instruments |
| US20090249301A1 (en) * | 2008-03-31 | 2009-10-01 | International Business Machines Corporation | Method and Apparatus for Testing Soft Error Rate of an Application Program |
| US8296739B2 (en) | 2008-03-31 | 2012-10-23 | International Business Machines Corporation | Testing soft error rate of an application program |
| US9235909B2 (en) | 2008-05-06 | 2016-01-12 | International Business Machines Corporation | Simplifying the presentation of a visually complex semantic model within a graphical modeling application |
| US8351678B1 (en) | 2008-06-11 | 2013-01-08 | United Services Automobile Association (Usaa) | Duplicate check detection |
| US8611635B1 (en) | 2008-06-11 | 2013-12-17 | United Services Automobile Association (Usaa) | Duplicate check detection |
| US20090319239A1 (en) * | 2008-06-18 | 2009-12-24 | International Business Machines Corporation | Topology modeling application that handles abstract entities through the realization of conceptual objects |
| US20090319058A1 (en) * | 2008-06-20 | 2009-12-24 | Invensys Systems, Inc. | Systems and methods for immersive interaction with actual and/or simulated facilities for process, environmental and industrial control |
| US8594814B2 (en) | 2008-06-20 | 2013-11-26 | Invensys Systems, Inc. | Systems and methods for immersive interaction with actual and/or simulated facilities for process, environmental and industrial control |
| US8291378B2 (en) | 2008-07-29 | 2012-10-16 | International Business Machines Corporation | Simplified deployment modeling |
| US8677317B2 (en) | 2008-07-29 | 2014-03-18 | International Business Machines Corporation | Simplified deployment modeling |
| US20100030893A1 (en) * | 2008-07-29 | 2010-02-04 | International Business Machines Corporation | Automated discovery of a topology of a distributed computing environment |
| US8849987B2 (en) | 2008-07-29 | 2014-09-30 | International Business Machines Corporation | Automated discovery of a topology of a distributed computing environment |
| US20100031247A1 (en) * | 2008-07-29 | 2010-02-04 | International Business Machines Corporation | Simplified deployment modeling |
| US8676856B2 (en) * | 2008-08-06 | 2014-03-18 | Statoil Petroleum As | Interactive rendering of physical entities |
| US20120117124A1 (en) * | 2008-08-06 | 2012-05-10 | Statoil Petroleum As | Interactive rendering of physical entities |
| US20100042572A1 (en) * | 2008-08-12 | 2010-02-18 | Haitham Mahmoud Al-Beik | Method for Dynamically Determining a Predetermined Previous Condition of a Rule-based System |
| US8271416B2 (en) | 2008-08-12 | 2012-09-18 | Stratus Technologies Bermuda Ltd. | Method for dynamically determining a predetermined previous condition of a rule-based system |
| US8302093B2 (en) | 2008-08-28 | 2012-10-30 | International Business Machines Corporation | Automated deployment of defined topology in distributed computing environment |
| US20100058331A1 (en) * | 2008-08-28 | 2010-03-04 | International Business Machines Corporation | Automated deployment of defined topology in distributed computing environment |
| US8422758B1 (en) | 2008-09-02 | 2013-04-16 | United Services Automobile Association (Usaa) | Systems and methods of check re-presentment deterrent |
| US10504185B1 (en) | 2008-09-08 | 2019-12-10 | United Services Automobile Association (Usaa) | Systems and methods for live video financial deposit |
| US11216884B1 (en) | 2008-09-08 | 2022-01-04 | United Services Automobile Association (Usaa) | Systems and methods for live video financial deposit |
| US11694268B1 (en) | 2008-09-08 | 2023-07-04 | United Services Automobile Association (Usaa) | Systems and methods for live video financial deposit |
| US8417658B2 (en) | 2008-09-12 | 2013-04-09 | International Business Machines Corporation | Deployment pattern realization with models of computing environments |
| US9223568B2 (en) | 2008-09-12 | 2015-12-29 | International Business Machines Corporation | Designing and cross-configuring software |
| US20100070449A1 (en) * | 2008-09-12 | 2010-03-18 | International Business Machines Corporation | Deployment pattern realization with models of computing environments |
| US9508039B2 (en) | 2008-09-12 | 2016-11-29 | Globalfoundries Inc. | Deployment pattern realization with models of computing environments |
| US8402381B2 (en) | 2008-09-23 | 2013-03-19 | International Business Machines Corporation | Automatically arranging widgets of a model within a canvas using iterative region based widget relative adjustments |
| US20100077328A1 (en) * | 2008-09-23 | 2010-03-25 | International Business Machines Corporation | Automatically arranging widgets of a model within a canvas using iterative region based widget relative adjustments |
| US7974899B1 (en) | 2008-09-30 | 2011-07-05 | United Services Automobile Association (Usaa) | Atomic deposit transaction |
| US7962411B1 (en) | 2008-09-30 | 2011-06-14 | United Services Automobile Association (Usaa) | Atomic deposit transaction |
| US9311634B1 (en) | 2008-09-30 | 2016-04-12 | United Services Automobile Association (Usaa) | Systems and methods for automatic bill pay enrollment |
| US7885880B1 (en) * | 2008-09-30 | 2011-02-08 | United Services Automobile Association (Usaa) | Atomic deposit transaction |
| US8391599B1 (en) | 2008-10-17 | 2013-03-05 | United Services Automobile Association (Usaa) | Systems and methods for adaptive binarization of an image |
| US7970677B1 (en) | 2008-10-24 | 2011-06-28 | United Services Automobile Association (Usaa) | Systems and methods for financial deposits by electronic message |
| US7949587B1 (en) | 2008-10-24 | 2011-05-24 | United States Automobile Association (USAA) | Systems and methods for financial deposits by electronic message |
| US9015593B2 (en) | 2008-12-01 | 2015-04-21 | International Business Machines Corporation | Managing advisories for complex model nodes in a graphical modeling application |
| US20100169880A1 (en) * | 2008-12-25 | 2010-07-01 | Voltaire Ltd. | Virtual input-output connections for machine virtualization |
| US8201168B2 (en) | 2008-12-25 | 2012-06-12 | Voltaire Ltd. | Virtual input-output connections for machine virtualization |
| US9230539B2 (en) | 2009-01-06 | 2016-01-05 | Regents Of The University Of Minnesota | Automatic measurement of speech fluency |
| US8494857B2 (en) | 2009-01-06 | 2013-07-23 | Regents Of The University Of Minnesota | Automatic measurement of speech fluency |
| US8452689B1 (en) | 2009-02-18 | 2013-05-28 | United Services Automobile Association (Usaa) | Systems and methods of check detection |
| US11749007B1 (en) | 2009-02-18 | 2023-09-05 | United Services Automobile Association (Usaa) | Systems and methods of check detection |
| US9946923B1 (en) | 2009-02-18 | 2018-04-17 | United Services Automobile Association (Usaa) | Systems and methods of check detection |
| US11062130B1 (en) | 2009-02-18 | 2021-07-13 | United Services Automobile Association (Usaa) | Systems and methods of check detection |
| US11062131B1 (en) | 2009-02-18 | 2021-07-13 | United Services Automobile Association (Usaa) | Systems and methods of check detection |
| US11721117B1 (en) | 2009-03-04 | 2023-08-08 | United Services Automobile Association (Usaa) | Systems and methods of check processing with background removal |
| US10956728B1 (en) | 2009-03-04 | 2021-03-23 | United Services Automobile Association (Usaa) | Systems and methods of check processing with background removal |
| US20100275200A1 (en) * | 2009-04-22 | 2010-10-28 | Dell Products, Lp | Interface for Virtual Machine Administration in Virtual Desktop Infrastructure |
| US20100293025A1 (en) * | 2009-05-15 | 2010-11-18 | International Business Machines Corporation | Dimensional service-oriented architecture solution modeling and composition |
| US8463964B2 (en) | 2009-05-29 | 2013-06-11 | Invensys Systems, Inc. | Methods and apparatus for control configuration with enhanced change-tracking |
| US8127060B2 (en) | 2009-05-29 | 2012-02-28 | Invensys Systems, Inc | Methods and apparatus for control configuration with control objects that are fieldbus protocol-aware |
| US8122434B2 (en) | 2009-05-29 | 2012-02-21 | Invensys Sytems, Inc. | Methods and apparatus for control configuration control objects associated with a track attribute for selecting configuration information |
| US20100305721A1 (en) * | 2009-05-29 | 2010-12-02 | Invensys Systems, Inc. | Methods and apparatus for control configuration with control objects that self-define tracked parameters |
| US20110016074A1 (en) * | 2009-07-16 | 2011-01-20 | International Business Machines | Method and system for encapsulation and re-use of models |
| US8799203B2 (en) | 2009-07-16 | 2014-08-05 | International Business Machines Corporation | Method and system for encapsulation and re-use of models |
| US8542921B1 (en) | 2009-07-27 | 2013-09-24 | United Services Automobile Association (Usaa) | Systems and methods for remote deposit of negotiable instrument using brightness correction |
| US11222315B1 (en) | 2009-08-19 | 2022-01-11 | United Services Automobile Association (Usaa) | Apparatuses, methods and systems for a publishing and subscribing platform of depositing negotiable instruments |
| US10896408B1 (en) | 2009-08-19 | 2021-01-19 | United Services Automobile Association (Usaa) | Apparatuses, methods and systems for a publishing and subscribing platform of depositing negotiable instruments |
| US9779392B1 (en) | 2009-08-19 | 2017-10-03 | United Services Automobile Association (Usaa) | Apparatuses, methods and systems for a publishing and subscribing platform of depositing negotiable instruments |
| US9818090B1 (en) | 2009-08-21 | 2017-11-14 | United Services Automobile Association (Usaa) | Systems and methods for image and criterion monitoring during mobile deposit |
| US11373150B1 (en) | 2009-08-21 | 2022-06-28 | United Services Automobile Association (Usaa) | Systems and methods for monitoring and processing an image of a check during mobile deposit |
| US11321678B1 (en) | 2009-08-21 | 2022-05-03 | United Services Automobile Association (Usaa) | Systems and methods for processing an image of a check during mobile deposit |
| US11321679B1 (en) | 2009-08-21 | 2022-05-03 | United Services Automobile Association (Usaa) | Systems and methods for processing an image of a check during mobile deposit |
| US8977571B1 (en) | 2009-08-21 | 2015-03-10 | United Services Automobile Association (Usaa) | Systems and methods for image monitoring of check during mobile deposit |
| US9569756B1 (en) | 2009-08-21 | 2017-02-14 | United Services Automobile Association (Usaa) | Systems and methods for image monitoring of check during mobile deposit |
| US11341465B1 (en) | 2009-08-21 | 2022-05-24 | United Services Automobile Association (Usaa) | Systems and methods for image monitoring of check during mobile deposit |
| US10235660B1 (en) | 2009-08-21 | 2019-03-19 | United Services Automobile Association (Usaa) | Systems and methods for image monitoring of check during mobile deposit |
| US11373149B1 (en) | 2009-08-21 | 2022-06-28 | United Services Automobile Association (Usaa) | Systems and methods for monitoring and processing an image of a check during mobile deposit |
| US8699779B1 (en) | 2009-08-28 | 2014-04-15 | United Services Automobile Association (Usaa) | Systems and methods for alignment of check during mobile deposit |
| US10855914B1 (en) | 2009-08-28 | 2020-12-01 | United Services Automobile Association (Usaa) | Computer systems for updating a record to reflect data contained in image of document automatically captured on a user's remote mobile phone displaying an alignment guide and using a downloaded app |
| US11064111B1 (en) | 2009-08-28 | 2021-07-13 | United Services Automobile Association (Usaa) | Systems and methods for alignment of check during mobile deposit |
| US9177198B1 (en) | 2009-08-28 | 2015-11-03 | United Services Automobile Association (Usaa) | Systems and methods for alignment of check during mobile deposit |
| US9177197B1 (en) | 2009-08-28 | 2015-11-03 | United Services Automobile Association (Usaa) | Systems and methods for alignment of check during mobile deposit |
| US10574879B1 (en) | 2009-08-28 | 2020-02-25 | United Services Automobile Association (Usaa) | Systems and methods for alignment of check during mobile deposit |
| US10848665B1 (en) | 2009-08-28 | 2020-11-24 | United Services Automobile Association (Usaa) | Computer systems for updating a record to reflect data contained in image of document automatically captured on a user's remote mobile phone displaying an alignment guide and using a downloaded app |
| US9336517B1 (en) | 2009-08-28 | 2016-05-10 | United Services Automobile Association (Usaa) | Systems and methods for alignment of check during mobile deposit |
| US9721042B2 (en) | 2009-08-31 | 2017-08-01 | Siemens Product Lifecycle Management Software, Inc. | System and method for use of function-based mechatronic objects |
| US20110054873A1 (en) * | 2009-08-31 | 2011-03-03 | Siemens Product Lifecycle Management Software Inc. | System and method for creation of function-based mechatronic objects |
| US20110055088A1 (en) * | 2009-08-31 | 2011-03-03 | Siemens Product Lifecycle Management Software Inc. | System and method for use of function-based mechatronic objects |
| US8522217B2 (en) | 2010-04-20 | 2013-08-27 | Microsoft Corporation | Visualization of runtime analysis across dynamic boundaries |
| US8655461B2 (en) * | 2010-05-25 | 2014-02-18 | Siemens Product Lifecycle Management Software Inc. | Method, system, and non-transitory computer readable storage medium for generating code for a closed-loop controller |
| US20110295391A1 (en) * | 2010-05-25 | 2011-12-01 | Siemens Product Lifecycle Management Software Inc. | Method and System for Closed-Loop Controller Programming |
| US11295377B1 (en) | 2010-06-08 | 2022-04-05 | United Services Automobile Association (Usaa) | Automatic remote deposit image preparation apparatuses, methods and systems |
| US11915310B1 (en) | 2010-06-08 | 2024-02-27 | United Services Automobile Association (Usaa) | Apparatuses, methods and systems for a video remote deposit capture platform |
| US8837806B1 (en) | 2010-06-08 | 2014-09-16 | United Services Automobile Association (Usaa) | Remote deposit image inspection apparatuses, methods and systems |
| US11068976B1 (en) | 2010-06-08 | 2021-07-20 | United Services Automobile Association (Usaa) | Financial document image capture deposit method, system, and computer-readable |
| US9779452B1 (en) | 2010-06-08 | 2017-10-03 | United Services Automobile Association (Usaa) | Apparatuses, methods, and systems for remote deposit capture with enhanced image detection |
| US8688579B1 (en) | 2010-06-08 | 2014-04-01 | United Services Automobile Association (Usaa) | Automatic remote deposit image preparation apparatuses, methods and systems |
| US10706466B1 (en) | 2010-06-08 | 2020-07-07 | United Services Automobile Association (Ussa) | Automatic remote deposit image preparation apparatuses, methods and systems |
| US11893628B1 (en) | 2010-06-08 | 2024-02-06 | United Services Automobile Association (Usaa) | Apparatuses, methods and systems for a video remote deposit capture platform |
| US10380683B1 (en) | 2010-06-08 | 2019-08-13 | United Services Automobile Association (Usaa) | Apparatuses, methods and systems for a video remote deposit capture platform |
| US9129340B1 (en) | 2010-06-08 | 2015-09-08 | United Services Automobile Association (Usaa) | Apparatuses, methods and systems for remote deposit capture with enhanced image detection |
| US11232517B1 (en) | 2010-06-08 | 2022-01-25 | United Services Automobile Association (Usaa) | Apparatuses, methods, and systems for remote deposit capture with enhanced image detection |
| US10621660B1 (en) | 2010-06-08 | 2020-04-14 | United Services Automobile Association (Usaa) | Apparatuses, methods, and systems for remote deposit capture with enhanced image detection |
| US11295378B1 (en) | 2010-06-08 | 2022-04-05 | United Services Automobile Association (Usaa) | Apparatuses, methods and systems for a video remote deposit capture platform |
| US9846628B2 (en) * | 2010-06-15 | 2017-12-19 | Microsoft Technology Licensing, Llc | Indicating parallel operations with user-visible events |
| US20110307905A1 (en) * | 2010-06-15 | 2011-12-15 | Microsoft Corporation | Indicating parallel operations with user-visible events |
| US9095002B2 (en) | 2010-07-12 | 2015-07-28 | Invensys Systems, Inc. | Methods and apparatus for process control with improved communication links |
| US8331855B2 (en) | 2010-07-12 | 2012-12-11 | Invensys Systems, Inc. | Methods and apparatus for process control with improved communication links |
| CN101944063A (en) * | 2010-09-21 | 2011-01-12 | 南京中德保护控制系统有限公司 | Real-time dynamic scheduling policy test method based on digital microkernel |
| CN101944063B (en) * | 2010-09-21 | 2012-06-13 | 南京中德保护控制系统有限公司 | Real-time dynamic scheduling policy test method based on digital microkernel |
| US9280335B2 (en) | 2010-09-30 | 2016-03-08 | International Business Machines Corporation | Semantically rich composable software image bundles |
| US9152877B2 (en) | 2010-11-24 | 2015-10-06 | Indian Statistical Institute | Rough wavelet granular space and classification of multispectral remote sensing image |
| US20130080140A1 (en) * | 2011-09-23 | 2013-03-28 | The Mathworks, Inc. | Using a requirements framework |
| US11544682B1 (en) | 2012-01-05 | 2023-01-03 | United Services Automobile Association (Usaa) | System and method for storefront bank deposits |
| US11062283B1 (en) | 2012-01-05 | 2021-07-13 | United Services Automobile Association (Usaa) | System and method for storefront bank deposits |
| US10380565B1 (en) | 2012-01-05 | 2019-08-13 | United Services Automobile Association (Usaa) | System and method for storefront bank deposits |
| US10769603B1 (en) | 2012-01-05 | 2020-09-08 | United Services Automobile Association (Usaa) | System and method for storefront bank deposits |
| US11797960B1 (en) | 2012-01-05 | 2023-10-24 | United Services Automobile Association (Usaa) | System and method for storefront bank deposits |
| US20130211871A1 (en) * | 2012-02-09 | 2013-08-15 | International Business Machines Corporation | Assessment and rationalization of resiliency of data center strategies |
| US8768742B2 (en) * | 2012-02-09 | 2014-07-01 | International Business Machines Corporation | Assessment and rationalization of resiliency of data center strategies |
| US9576593B2 (en) | 2012-03-15 | 2017-02-21 | Regents Of The University Of Minnesota | Automated verbal fluency assessment |
| US8793652B2 (en) | 2012-06-07 | 2014-07-29 | International Business Machines Corporation | Designing and cross-configuring software |
| US9405529B2 (en) | 2012-06-07 | 2016-08-02 | International Business Machines Corporation | Designing and cross-configuring software |
| CN102880517A (en) * | 2012-09-29 | 2013-01-16 | 中国人民解放军国防科学技术大学 | Method for scheduling objects of HLA (high level architecture) simulation program on basis of super computer |
| US20140149084A1 (en) * | 2012-11-27 | 2014-05-29 | Autodesk, Inc. | Goal-driven computer aided design workflow |
| US9690880B2 (en) * | 2012-11-27 | 2017-06-27 | Autodesk, Inc. | Goal-driven computer aided design workflow |
| US10747913B2 (en) * | 2012-11-27 | 2020-08-18 | Autodesk, Inc. | Goal-driven computer aided design workflow |
| US10552810B1 (en) | 2012-12-19 | 2020-02-04 | United Services Automobile Association (Usaa) | System and method for remote deposit of financial instruments |
| US9501586B2 (en) | 2013-02-27 | 2016-11-22 | Lenovo Enterprise Solutions (Singapore) Pte. Ltd. | Displaying data sets across a plurality of views of a user interface |
| US10560511B2 (en) | 2013-05-10 | 2020-02-11 | Success Factors, Inc. | Adaptive tile framework |
| US9807145B2 (en) | 2013-05-10 | 2017-10-31 | Successfactors, Inc. | Adaptive tile framework |
| US11138578B1 (en) | 2013-09-09 | 2021-10-05 | United Services Automobile Association (Usaa) | Systems and methods for remote deposit of currency |
| US9286514B1 (en) | 2013-10-17 | 2016-03-15 | United Services Automobile Association (Usaa) | Character count determination for a digital image |
| US11281903B1 (en) | 2013-10-17 | 2022-03-22 | United Services Automobile Association (Usaa) | Character count determination for a digital image |
| US11144753B1 (en) | 2013-10-17 | 2021-10-12 | United Services Automobile Association (Usaa) | Character count determination for a digital image |
| US11694462B1 (en) | 2013-10-17 | 2023-07-04 | United Services Automobile Association (Usaa) | Character count determination for a digital image |
| US10360448B1 (en) | 2013-10-17 | 2019-07-23 | United Services Automobile Association (Usaa) | Character count determination for a digital image |
| US9904848B1 (en) | 2013-10-17 | 2018-02-27 | United Services Automobile Association (Usaa) | Character count determination for a digital image |
| US10410178B2 (en) | 2015-03-16 | 2019-09-10 | Moca Systems, Inc. | Method for graphical pull planning with active work schedules |
| US10302741B2 (en) * | 2015-04-02 | 2019-05-28 | Texas Instruments Incorporated | Method and apparatus for live-object detection |
| US10402790B1 (en) | 2015-05-28 | 2019-09-03 | United Services Automobile Association (Usaa) | Composing a focused document image from multiple image captures or portions of multiple image captures |
| US11478215B2 (en) | 2015-06-15 | 2022-10-25 | The Research Foundation for the State University o | System and method for infrasonic cardiac monitoring |
| US10542961B2 (en) | 2015-06-15 | 2020-01-28 | The Research Foundation For The State University Of New York | System and method for infrasonic cardiac monitoring |
| US10677948B2 (en) | 2016-03-04 | 2020-06-09 | General Electric Company | Context based bounded hydrocarbon formation identification |
| US10133953B2 (en) * | 2017-01-26 | 2018-11-20 | Nice Ltd. | System and method for enabling graphic-based interoperability with a run-time application |
| US11061661B2 (en) | 2017-01-26 | 2021-07-13 | Nice Ltd. | Image based method and system for building object model and application states comparison and graphic-based interoperability with an application |
| US10740123B2 (en) | 2017-01-26 | 2020-08-11 | Nice Ltd. | Method and system for accessing table content in a digital image of the table |
| US11307875B2 (en) | 2017-01-26 | 2022-04-19 | Nice Ltd. | Method and system for accessing table content in a digital image of the table |
| US10540167B2 (en) | 2017-01-26 | 2020-01-21 | Nice Ltd. | Image based method and system for building object model and application states comparison and graphic-based interoperability with an application |
| US11755347B2 (en) | 2017-01-26 | 2023-09-12 | Nice Ltd. | Method and system for accessing table content in a digital image of the table |
| US11625531B2 (en) * | 2018-02-07 | 2023-04-11 | Nec Corporation | Information processing apparatus, information processing method, and computer-readable recording medium |
| US20210064825A1 (en) * | 2018-02-07 | 2021-03-04 | Nec Corporation | Information processing apparatus, information processing method, and computer-readable recording medium |
| US11030752B1 (en) | 2018-04-27 | 2021-06-08 | United Services Automobile Association (Usaa) | System, computing device, and method for document detection |
| US11676285B1 (en) | 2018-04-27 | 2023-06-13 | United Services Automobile Association (Usaa) | System, computing device, and method for document detection |
| US11900755B1 (en) | 2020-11-30 | 2024-02-13 | United Services Automobile Association (Usaa) | System, computing device, and method for document detection and deposit processing |
| US11790110B2 (en) | 2021-02-09 | 2023-10-17 | Nice Ltd. | System and method for preventing sensitive information from being recorded |
| CN113076661B (en) * | 2021-04-28 | 2022-08-12 | 中国人民解放军国防科技大学 | Uncertain data driven radar early warning detection modeling method |
| CN113076661A (en) * | 2021-04-28 | 2021-07-06 | 中国人民解放军国防科技大学 | Uncertain data driven radar early warning detection modeling method |
| US11725924B2 (en) * | 2021-08-10 | 2023-08-15 | Palo Alto Research Center Incorporated | Controlling mechanical systems based on natural language input |
| US20230051136A1 (en) * | 2021-08-10 | 2023-02-16 | Palo Alto Research Center Incorporated | Controlling mechanical systems based on natural language input |
| CN113904348B (en) * | 2021-10-22 | 2023-08-01 | 三峡大学 | Multi-microgrid low-frequency load shedding control method with self-adaptive variation capability |
| CN113904348A (en) * | 2021-10-22 | 2022-01-07 | 三峡大学 | Multi-microgrid low-frequency load shedding control method with self-adaptive variation capability |
Also Published As
| Publication number | Publication date |
|---|---|
| WO2000065488A1 (en) | 2000-11-02 |
Similar Documents
| Publication | Publication Date | Title |
|---|---|---|
| US6789054B1 (en) | Geometric display tools and methods for the visual specification, design automation, and control of adaptive real systems | |
| Wonham et al. | Supervisory control of discrete-event systems: A brief history | |
| Kleijnen et al. | State-of-the-art review: a user’s guide to the brave new world of designing simulation experiments | |
| Mayer et al. | A framework and a suite of methods for business process reengineering | |
| Chiola et al. | GreatSPN 1.7: Graphical editor and analyzer for timed and stochastic Petri nets | |
| Barnett et al. | An architecture for the virtual enterprise | |
| Fan et al. | Petri net based techniques for constructing reliable service composition | |
| Scacchi et al. | Process life cycle engineering: a knowledge‐based approach and environment | |
| Klashner et al. | A DSS design model for complex problems: Lessons from mission critical infrastructure | |
| Bruno et al. | Modeling the enterprise engineering environment | |
| Thiagarajan et al. | Awas: AADL information flow and error propagation analysis framework | |
| Wu et al. | Coping with legacy system migration complexity | |
| Basnet et al. | Experiences in developing an object-oriented modeling environment for manufacturing systems | |
| Bohács et al. | Production logistics simulation supported by process description languages | |
| Alt et al. | Using high-level petri nets for hierarchical grid workflows | |
| Antonova et al. | Frame-based expert system implementation for resource conversion processes analysis | |
| Kluza et al. | Proposal of a hierarchical approach to formal verification of BPMN models using Alvis and XTT2 methods | |
| Zhou et al. | Ontology-based software reliability modelling | |
| Bruno et al. | Making CIMOSA operational | |
| Rozenblit | Systems Design: a simulation modeling framework | |
| Nordstrom et al. | Model integrated computing-based software design and evolution | |
| Bellman | Model-based design, engineering, and development: advancements mean new opportunities for space system development | |
| Lin et al. | Incorporating conversation managers into multi-agent systems | |
| US20140067747A1 (en) | Object based method to evaluate rules | |
| Li | A smart products lifecycle management (sPLM) framework-modeling for conceptualization, interoperability, and modularity |
Legal Events
| Date | Code | Title | Description |
|---|---|---|---|
| REMI | Maintenance fee reminder mailed | ||
| FPAY | Fee payment |
Year of fee payment: 4 |
|
| SULP | Surcharge for late payment | ||
| FPAY | Fee payment |
Year of fee payment: 8 |
|
| REMI | Maintenance fee reminder mailed | ||
| LAPS | Lapse for failure to pay maintenance fees | ||
| STCH | Information on status: patent discontinuation |
Free format text: PATENT EXPIRED DUE TO NONPAYMENT OF MAINTENANCE FEES UNDER 37 CFR 1.362 |
|
| FP | Lapsed due to failure to pay maintenance fee |
Effective date: 20160907 |