EP1456666B1 - Method for the determination of glucose - Google Patents
Method for the determination of glucose Download PDFInfo
- Publication number
- EP1456666B1 EP1456666B1 EP02787588A EP02787588A EP1456666B1 EP 1456666 B1 EP1456666 B1 EP 1456666B1 EP 02787588 A EP02787588 A EP 02787588A EP 02787588 A EP02787588 A EP 02787588A EP 1456666 B1 EP1456666 B1 EP 1456666B1
- Authority
- EP
- European Patent Office
- Prior art keywords
- measurement
- blood
- concentration
- glucose
- hematocrit
- Prior art date
- Legal status (The legal status is an assumption and is not a legal conclusion. Google has not performed a legal analysis and makes no representation as to the accuracy of the status listed.)
- Expired - Lifetime
Links
Images


Classifications
-
- G—PHYSICS
- G01—MEASURING; TESTING
- G01N—INVESTIGATING OR ANALYSING MATERIALS BY DETERMINING THEIR CHEMICAL OR PHYSICAL PROPERTIES
- G01N33/00—Investigating or analysing materials by specific methods not covered by groups G01N1/00 - G01N31/00
- G01N33/48—Biological material, e.g. blood, urine; Haemocytometers
- G01N33/50—Chemical analysis of biological material, e.g. blood, urine; Testing involving biospecific ligand binding methods; Immunological testing
- G01N33/5005—Chemical analysis of biological material, e.g. blood, urine; Testing involving biospecific ligand binding methods; Immunological testing involving human or animal cells
- G01N33/5094—Chemical analysis of biological material, e.g. blood, urine; Testing involving biospecific ligand binding methods; Immunological testing involving human or animal cells for blood cell populations
-
- G—PHYSICS
- G01—MEASURING; TESTING
- G01N—INVESTIGATING OR ANALYSING MATERIALS BY DETERMINING THEIR CHEMICAL OR PHYSICAL PROPERTIES
- G01N27/00—Investigating or analysing materials by the use of electric, electrochemical, or magnetic means
- G01N27/26—Investigating or analysing materials by the use of electric, electrochemical, or magnetic means by investigating electrochemical variables; by using electrolysis or electrophoresis
- G01N27/28—Electrolytic cell components
- G01N27/30—Electrodes, e.g. test electrodes; Half-cells
- G01N27/327—Biochemical electrodes, e.g. electrical or mechanical details for in vitro measurements
- G01N27/3271—Amperometric enzyme electrodes for analytes in body fluids, e.g. glucose in blood
- G01N27/3274—Corrective measures, e.g. error detection, compensation for temperature or hematocrit, calibration
-
- Y—GENERAL TAGGING OF NEW TECHNOLOGICAL DEVELOPMENTS; GENERAL TAGGING OF CROSS-SECTIONAL TECHNOLOGIES SPANNING OVER SEVERAL SECTIONS OF THE IPC; TECHNICAL SUBJECTS COVERED BY FORMER USPC CROSS-REFERENCE ART COLLECTIONS [XRACs] AND DIGESTS
- Y10—TECHNICAL SUBJECTS COVERED BY FORMER USPC
- Y10T—TECHNICAL SUBJECTS COVERED BY FORMER US CLASSIFICATION
- Y10T436/00—Chemistry: analytical and immunological testing
- Y10T436/14—Heterocyclic carbon compound [i.e., O, S, N, Se, Te, as only ring hetero atom]
- Y10T436/142222—Hetero-O [e.g., ascorbic acid, etc.]
- Y10T436/143333—Saccharide [e.g., DNA, etc.]
- Y10T436/144444—Glucose
Definitions
- This invention relates to methods for the determination of the concentrations of biologically significant components of bodily fluids. It is disclosed in the context of methods and apparatus for the determination of glucose concentration in blood, a blood fraction or a control, but is believed to be useful in other applications as well.
- Zhao "Contributions of Suspending Medium to Electrical Impedance of Blood," Biochimica et Biophysica Acta, Vol. 1201, pp. 179-185 (1994 ); Zhao, “Electrical Impedance and Haematocrit of Human Blood with Various Anticoagulants,” Physiol. Meas., Vol. 14, pp. 299-307 (1993 ); Muller, et al., “Influence of Hematocrit and Platelet Count on Impedance and Reactivity of Whole Blood for Electrical Aggregometry,” Journal of Pharmacological and Toxicological Methods, Vol. 34, pp.
- US 6,153,069 discloses an apparatus for measuring compounds, e.g. glucose, in a sample fluid.
- the apparatus comprises an amperometric device for measuring Cottrell currents and a microprocessor for converting the currents into analyte concentrations.
- T.X. Zhao, Physiol, Meas. 14 (1993) 299-307 discusses the effect of various anticoagulants on electrical impedance parameters of human blood at 37°C with hematocrit values in the range of 20 - 60 %.
- US 5,352,351 and DE 94 22 380 U1 concern a biosensing meter with fail-safe procedures that uses disposable sample strips and electrically isolated sense and excitation electrodes e.g. to detect glucose and cholesterol levels in blood
- WO 01/57510 A2 teaches a method and a meter for determining the hematocrit corrected concentration of an analyte (especially glucose) in a sample (especially whole blood).
- the method requires multiplying a preliminary analyte concentration less a background value by a hematocrit correction factor to derive the hematocrit corrected analyte concentration in the sample.
- the clinically significant index of blood glucose is its concentration in the serum, the clear fraction of whole blood after separation of red cells, white cells and plasma.
- concentration is determined by any of a variety of chemical and Electrochemical methods.
- a predefined sample of serum is transferred from the blood collection receptacle to a reaction vessel in which reagents are combined to produce a chemical reaction whose product is proportional to the total amount of glucose contained in the sample.
- the product of the chemical reaction can be quantified by gauging optical or electrochemical changes in the reaction mixture, represented as electrical signals or numerical values in digital format.
- Internal measurement units so obtained such as optical absorbency, microamperes, and so on, can be converted into reportable clinical units such as milligrams per deciliter or the like, by a blood glucose testing instrument calibration process performed as part of the overall clinical procedure.
- the translated glucose concentration values are reported directly in units desired by the clinician.
- the excluded blood fractions do not figure either in the measurement or the translation process. This is not the case for a system in which the sample is in the form of whole blood.
- the coexisting blood fractions may affect the reported values, either through physical or chemical interference with the measurement process per se or due to their physical displacement of serum in the sample volume. That is, because the wet chemistry measures total glucose in the sample, the reported serum concentrations will vary as the relative fraction of the serum component varies from sample to sample (usually from individual to individual). In practice, the principle interference is from the red and white blood cells.
- the calibration procedure for monitors is relatively complicated.
- calibration is performed in two steps.
- a large number of test strips in multiple whole blood monitors measure a series of synthetic working standards having a range of predetermined concentrations.
- the standards are quite stable, and are available in relatively large quantities.
- the standards' values are used to construct (a) working relationship(s) between the monitors' responses and the standards' concentrations. This step provides a large number of determinations which are then pooled statistically for increased precision over the monitor and test strip populations.
- instrument response measurements are performed on whole blood samples from a relatively smaller population of human donors, which are paired with glucose values determined by the reference serum methodology to adjust the working curve to yield true reportable values.
- This step accounts on a statistical basis for the unique properties of human blood.
- human donors provide, as they should, the ultimate basis for monitor results.
- hematocrit The decimal fraction of whole blood volume occupied by red cells is known as hematocrit. Hematocrit correction on whole blood determinations would not be necessary if hematocrit did not vary from person to person, because its effect could be taken into account in the calibration process by introducing whole blood samples into the instrument during calibration and relating their internally-measured numbers to corresponding serum values determined during the reference phase of the calibration process. However, hematocrit values can vary between about 0.2 for individuals who suffer from anemia and about 0.6 for newborns. Since a glucose determination is subject to about a one percent variation for each percent hematocrit variation, the resulting uncertainty in indicated glucose concentration would be clinically undesirable.
- the present invention concerns an in-vitro method for determining glucose, as defined in the claims.
- This application teaches an instrument and associated chemical and mathematical methods by which glucose and hematocrit are determined on a single sample and a single test strip.
- This application also teaches an instrument and methods by which a data stream from such an instrument's reaction sensor can be processed by internal computational apparatus in such a manner as to decompose the data into components separately representing hematocrit and glucose concentration which can then be individually calibrated to report clinical values.
- hematocrit it is not necessary in diabetes management to report hematocrit. It is only necessary to free the measurement of glucose concentration from the effect of hematocrit.
- a hand-held instrument which reports both values, such as, for example, an emergency room, a battlefield, and so on.
- numerical components separately representing glucose concentration and hematocrit can be individually calibrated and translated to report clinical values.
- the invention is useful in other systems besides glucose concentration and hematocrit. Using appropriate sensor technology, other analytes can be detected and their concentrations in a sample determined and reported.
- reaction dynamics may produce such an interaction between the two components that separating the results of the two may require solution of a pair of simultaneous equations by algebraic means or by regression analysis.
- the two measurements proceed essentially simultaneously in a single passage of the sample through the instrument.
- Glucose measurements on whole blood are intrinsically sensitive to hematocrit, principally, it is believed, through the volume exclusion effect. That is, the greater the hematocrit, the less glucose is available for the glucose oxidase reaction. Hence, in order to better the accuracy of such instruments, it is necessary to design the instruments and their glucose concentration determination algorithms around hematocrit, or to develop instruments and algorithms which measure hematocrit and compensate indicated glucose concentrations for the measured hematocrit, thus obtaining hematocrit-corrected glucose readings.
- Patents: 5,243,516 ; 5,288,636 ; 5,352,351 ; 5,385,846 ; and 5,508,171 for example, provides an incubation time, for example, ten seconds, for (a) reaction(s) to occur on a strip 22 of the general type illustrated and described in U. S. Patents: 5,243,516 ; 5,288,636 ; 5,352,351 ; 5,385,846 ; 5,508,171 ; and 5,997,817 . Instrument 20 then applies across a pair of electrodes 26, 28 of strip 22 a step function voltage 30, Fig.
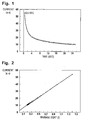
- the Cottrell equation predicts that current will decrease as the inverse of the square root of time after the application of the step function voltage 30. M is directly proportional to analyte concentration.
- Fig. 1 illustrates a typical plot of Cottrell current i versus time t.
- Fig. 2 illustrates typical plots of i versus 1/ ⁇ (t). Five sets of these data are illustrated in Table 1.
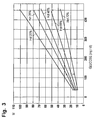
- Fig. 3 illustrates plots of M versus glucose concentration at different hematocrits for an illustrative set of data.
- the constant, or iso-, hematocrit contours form a manifold of separated, nearly straight lines that converge at a point near zero glucose concentration.
- the lines' slopes indicate relatively high sensitivity to variation in glucose concentration.
- the sought-after glucose concentration might fall on any line in the manifold, depending upon the hematocrit of the sample.
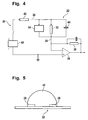
- Fig. 4 illustrates an equivalent circuit model that models with a few conventional circuit elements the electrical performance of instrument 20 and strip 22.
- the circuit illustrated in Fig. 4 includes a resistor 32 that represents the ionic current flowing in the bulk of the reaction volume, as distinct from the Cottrell current source 34 that represents the electrochemical charge transfer and exhibits the 1/ ⁇ (t) variability noted in the above equation.
- i-v current-to-voltage
- A/D analog-to-digital
- the Cottrell current generator 34 and resistors 32 and 44 accurately represent the equivalent circuit.
- the strip capacitance 40 acts as a transitory short circuit and Cottrell current cannot build up until the voltage across capacitance 40 is charged up, through resistor 44, to the step height.
- this time is less than a tenth of a second. Accordingly, for very short times (t ⁇ 1 sec.), the capacitance 40 associated with strip 22 and sample 42 must also be included in the model, in parallel with the resistor 32 and the Cottrell current source 34. Following completion of the charge-transfer process, resistors 32 and 44 account for the residual current represented by the B parameter.
- Capacitance 40 can be appreciated by referring to Fig. 5 , a schematic view of strip 22 with an applied sample 42, looking outward from the strip 22 port on instrument 20, that is, along the strip 22 electrodes 26, 28 toward the applied sample 42.
- the electrodes 26, 28 of strip 22 form a pair of parallel plates 26, 28 having areas A, separated by a distance d.
- An illustratively somewhat hemispherical space above strip 22 and between the electrodes 26, 28 is filled with the sample 42 including whatever reagent(s), etc., are dissolved, suspended, or otherwise present, with or in the sample 42.
- the capacitance 40 should vary with hematocrit, to the extent that the dielectric properties of plasma and red blood cells differ.
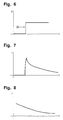
- Capacitance 40 can be quantified in a number of ways. For this application, the method involves utilizing the same hardware as an instrument designed to measure Cottrell current exclusively, while revising the associated software. Referring particularly to Fig. 7 , if instrument 20 applies a step function voltage 30 across the strip 22 electrodes 26, 28, that voltage step 30 must charge the capacitance 40 of strip 22 and sample 42. As capacitance 40 is charged, the voltage across the strip electrodes 26, 28 asymptotically approaches a steady state value. The charging current spike has an initial value equal to the amplitude of the voltage step 30 divided by the internal resistance 44 of instrument 20, plus the leakage current of strip 22.
- Fig. 7 illustrates such a sum current trace.
- Table 2 data group 1 2 3 4 5 mean of data groups standard deviation of data groups coefficients of variation of data groups Cottrell current slope M at time t 14.89 13.39 14.82 11.93 15.33 14.07 1.25 8.91 Cottrell curve intercept B 1.27 1.56 1.28 1.88 1.30 1.46 0.24 16.30 measured i(t) -B 142.96 132.12 143.06 135.82 148.48 140.49 5.80 4.13 Cottrell component 105.29 94.71 104.79 84.36 108.39 99.51 8.86 8.91 Deficit D 37.67 37.41 38.27 51.46 40.09 40.98 5.32 12.98 D/(i(t)-B)x 100% 26.35 28.32 26.75 37.89 27.00 29.26 4.36 14.91
- Table 3 contains calculated values for M and D for each of the fifteen data points (three different glucose concentrations times five different hematocrits) in one run.
- equations (3) and (4) can be inverted, numerically or algebraically, to yield the glucose and hematocrit values for a pair of M, D values measured on a sample whose glucose and hematocrit values were unknown.
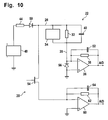
- the circuit illustrated in Fig. 10 provides an alternative technique for analyzing the behavior of the strip 22/applied sample 42 that is compatible with the measurement parts of instrument 20 and strip 22, but circuit and software are revised to give a longer measurement interval for the capacitance.
- a programmed voltage source 48 and internal resistance 44 are coupled in series between the instrument 20 ground, or common, terminal and the anode of a blocking diode 50.
- the cathode of blocking diode 50 is coupled through the parallel combination of Cottrell current generator 34, asymptotic current resistor 32 and capacitor 40 to the inverting, or -, input terminal of a differential amplifier 36.
- the - input terminal of amplifier 36 is coupled through a parallel RC feedback circuit including a feedback resistor 38 and a feedback capacitor 52, to its output terminal.
- the measurement of the current through the strip 22 proceeds as described above, and the output from amplifier 36 is sampled and A/D converted for further processing by the instrument 20.
- the strip 22 capacitance 40 is discharged to determine the charge accumulated on it during the current measurement phase.
- the programmed voltage source 48 is stilled, and a Field Effect Transistor (FET) switch 54 is turned on.
- FET Field Effect Transistor
- ground is coupled through a bypass diode 56 to the parallel combination of the Cottrell current generator 34, resistor 32 and capacitor 40 and through the FET switch 54 to the - input terminal of an amplifier 60.
- the - input terminal of amplifier 60 is coupled through the parallel combination of a feedback resistor 62 and a feedback capacitor 64 to its output terminal.
- the - input terminal of amplifier 60 is also coupled through the feedback resistor 62/feedback capacitor 64 parallel combination to its output.
- the output from amplifier 60 is sampled and A/D converted for further processing by the instrument 20.
- the programmed voltage source 48, internal resistance 44, blocking diode 50, bypass diode 56, amplifiers 36, 60, and their associated feedback resistors 38, 62, and capacitors 52, 64, and FET switch 54 are, of course, within the instrument 20.
- Strip 22 is modeled by the Cottrell current source 34, resistor 32 and capacitor 40 coupled in parallel between the cathode of blocking diode 50 and the cathode of bypass diode 56.
- FET switch 54 is off, isolating the strip 22 circuit model from the inverting (-) input terminal of amplifier 60.
- the FET switch 54 is turned on, and the strip 22 capacitance 40 is measured through instrument 20's amplifier 60, the output of which can be A/D converted by instrument 20 and used to calculate capacitance 40.
- Both embodiments discussed above obtain hematocrit-free glucose determinations or simultaneous determinations of both hematocrit and glucose, making use of their relationships to circuit elements in the equivalent circuit of Fig. 4 .
- This is accomplished by measuring some feature of the output current of the circuit subject to step function input voltage 38 of a waveform that rapidly rises to a steady state value which is maintained for the duration of the measurement interval.
- the current amplitude over time normalized to that of the step, is known as the indicial admittance. See, for example, E. Weber, Linear Transient Analysis, John Wiley and Sons, N. Y., 1954 .
- Such indicial admittance completely characterizes the electrical properties of the circuit, and can be transformed mathematically to resolve values for the individual circuit elements.
- i 2 (t) is the indicial admittance of the strip and sample, a single point of which has sufficed to illustrate the principle of identifying separate analytes with separate circuit elements.
- Linear Transient Analysis teaches at page 173 that a circuit's properties can be equivalently characterized by its impedance function, the ratio of amplitude of an applied sinusoidal voltage V( ⁇ ) to the complex circuit current I( ⁇ ), V/I as a function of frequency ⁇ .
- the temporal and frequency representations are related by a set of integral equations, also taught at Linear Transient Analysis, page 73, that are readily reduced to transform between them.
- the measurement could be made by using a constant-amplitude, swept frequency, sinusoidal voltage generator, and recording the amplitude and phase of the output sinusoidal current, the two methods being electrically entirely equivalent.
- various indices of the real and imaginary components of the impedance function can be extracted which, when regressed on assay values in a calibration reference set, will yield relations for the assay values of patient samples.
Abstract
Description
- This invention relates to methods for the determination of the concentrations of biologically significant components of bodily fluids. It is disclosed in the context of methods and apparatus for the determination of glucose concentration in blood, a blood fraction or a control, but is believed to be useful in other applications as well.
- Various methods and apparatus for the determination of the concentrations of medically significant components of body fluids are known. There are, for example, the methods and apparatus illustrated and described in the following listed references:
U. S. Patents: 3,770,607 ;3,838,033 ;3,902,970 ;3,925,183 ;3,937,615 ;4,005,002 ;4,040,908 ;4,086,631 ;4,123,701 ;4,127,448 ;4,214,968 ;4,217,196 ;4,224,125 ;4,225,410 ;4,230,537 ;4,260,680 ;4,263,343 ;4,265,250 ;4,273,134 ;4,301,412 ;4,303,887 ;4,366,033 ;4,407,959 ;4,413,628 ;4,420,564 ;4,431,004 ;4,436,094 ;4,440,175 ;4,477,314 ;4,477,575 ;4,499,423 ;4,517,291 ;4,654,197 ;4,671,288 ;4,679,562 ;4,682,602 ;4,703,756 ;4,711,245 ;4,734,184 ;4,750,496 ;4,759,828 ;4,789,804 ;4,795,542 ;4,805,624 ;4,816,224 ;4,820,399 ;4,871,258 ;4,897,162 ;4,897,173 ;4,919,770 ;4,927,516 ;4,935,106 ;4,938,860 ;4,940,945 ;4,970,145 ;4,975,647 ;4,999,582 ;4,999,632 ;5,053,199 ;5,011,290 ;5,108,564 ;5,128,015 ;5,160,980 ;5,232,668 ;5,243,516 ;5,246,858 ;5,269,891 ;5,284,770 ;5,288,636 ;5,312,762 ;5,352,351 ;5,366,609 ;5,371,687 ;5,379,214 ;5,385,846 ;5,395,504 ;5,469,846 ;5,508,171 ;5,508,203 ;5,509,410 ;5,512,489 ;5,522,255 ;5,594,906 ;5,686,659 ;5,710,622 ;5,789,664 ;5,792,944 ;5,832,921 ;5,841,023 ;5,942,102 ; and5,997,817 :WO98/35225 WO99/28736 WO99/32881 WO99/32881 German Patent Specification 3,228,542 :European Patent Specifications: 206,218 230,472 241,309 255,291 471,986 JP 63-128,252 63-111,453 - There are also the methods and apparatus described in: Talbott, et al, "A New Microchemical Approach to Amperometric Analysis," Microchemical Journal, Vol. 37, pp. 5-12 (1988); Morris, et al, "An Electrochemical Capillary Fill Device for the Analysis of Glucose Incorporating Glucose Oxidase and Ruthenium (III) Hexamine as Mediator, Electroanalysis," Vol. 4, pp. 1-9 (1992); Cass, et al, "Ferrocene-Mediated Enzyme Electrode for Amperometric Determination of Glucose," Anal. Chem., Vol. 56, pp. 667-671 (1984); Zhao, "Contributions of Suspending Medium to Electrical Impedance of Blood," Biochimica et Biophysica Acta, Vol. 1201, pp. 179-185 (1994); Zhao, "Electrical Impedance and Haematocrit of Human Blood with Various Anticoagulants," Physiol. Meas., Vol. 14, pp. 299-307 (1993); Muller, et al., "Influence of Hematocrit and Platelet Count on Impedance and Reactivity of Whole Blood for Electrical Aggregometry," Journal of Pharmacological and Toxicological Methods, Vol. 34, pp. 17-22 (1995); Preidel, et al, "In Vitro Measurements with Electrocatalytic Glucose Sensor in Blood," Biomed. Biochim. Acta, Vol. 48, pp. 897-903 (1989); Preidel, et al, "Glucose Measurements by Electrocatalytic Sensor in the Extracorporeal Blood Circulation of a Sheep," Sensors and Actuators B, Vol. 2, pp.257-263 (1990); Saeger, et al, "Influence of Urea on the Glucose Measurement by Electrocatalytic Sensor in the Extracorporeal Blood Circulation of a Sheep," Biomed. Biochim. Acta, Vol. 50, pp. 885-891 (1991); Kasapbasioglu, et al, "An Impedance Based Ultra-Thin Platinum Island Film Glucose Sensor," Sensors and Actuators B, Vol. 13-14, pp. 749-751 (1993); Beyer, et al, "Development and Application of a New Enzyme Sensor Type Based on the EIS-Capacitance Structure for Bioprocess Control," Biosensors & Bioelectronics, Vol. 9, pp. 17-21 (1994); Mohri, et al, "Characteristic Response of Electrochemical Nonlinearity to Taste Compounds with a Gold Electrode Modified with 4-Aminobenzenethiol," Bull. Chem. Soc. Jpn., Vol. 66, pp. 1328-1332 (1993); Cardosi, et al, "The Realization of Electron Transfer from Biological Molecules to Electrodes, "Biosensors Fundamentals and Applications, chapt. 15 (Turner, et al, eds., Oxford University Press, 1987); Mell, et al, "Amperometric Response Enhancement of the Immobilized Glucose Oxidase Enzyme Electrode," Analytical Chemistry, Vol. 48, pp. 1597-1601 (Sept. 1976); Mell, et al, "A Model for the Amperometric Enzyme Electrode Obtained Through Digital Simulation and Applied to the Immobilized Glucose Oxidase System," Analytical Chemistry, Vol. 47, pp. 299-307 (Feb. 1975); Myland, et al, "Membrane-Covered Oxygen Sensors: An Exact Treatment of the Switch-on Transient," Journal of the Electrochemical Society, Vol. 131, pp. 1815-1823 (Aug. 1984); Bradley, et al, "Kinetic Analysis of Enzyme Electrode Response," Anal. Chem., Vol. 56, pp. 664-667 (1984); Koichi,"Measurements of Current-Potential Curves, 6, Cottrell Equation and its Analogs. What Can We Know from Chronoamperometry?" Denki Kagaku oyobi Kogyo Butsuri Kagaku, Vol. 54, no.6, pp. 471-5 (1986); Williams, et al, "Electrochemical-Enzymatic Analysis of Blood Glucose and Lactate," Analytical Chemistry, Vol. 42, no. 1, pp. 118-121 (Jan. 1970); and, Gebhardt, et al, "Electrocatalytic Glucose Sensor," Siemens Forsch.-u. Entwickl.-Ber. Bd., Vol. 12, pp. 91-95 (1983).
-
US 6,153,069 discloses an apparatus for measuring compounds, e.g. glucose, in a sample fluid. The apparatus comprises an amperometric device for measuring Cottrell currents and a microprocessor for converting the currents into analyte concentrations. - T.X. Zhao, Physiol, Meas. 14 (1993) 299-307 discusses the effect of various anticoagulants on electrical impedance parameters of human blood at 37°C with hematocrit values in the range of 20 - 60 %.
-
US 5,352,351 andDE 94 22 380 U1 concern a biosensing meter with fail-safe procedures that uses disposable sample strips and electrically isolated sense and excitation electrodes e.g. to detect glucose and cholesterol levels in blood -
WO 01/57510 A2 - This listing is not intended as a representation that a complete search of all relevant prior art has been conducted, or that no better references than those listed exist. Nor should any such representation be inferred.
- The clinically significant index of blood glucose, as used in the diagnosis and management of diabetes, is its concentration in the serum, the clear fraction of whole blood after separation of red cells, white cells and plasma. The concentration is determined by any of a variety of chemical and Electrochemical methods.
- Typically, a predefined sample of serum is transferred from the blood collection receptacle to a reaction vessel in which reagents are combined to produce a chemical reaction whose product is proportional to the total amount of glucose contained in the sample. The product of the chemical reaction can be quantified by gauging optical or electrochemical changes in the reaction mixture, represented as electrical signals or numerical values in digital format. Internal measurement units so obtained, such as optical absorbency, microamperes, and so on, can be converted into reportable clinical units such as milligrams per deciliter or the like, by a blood glucose testing instrument calibration process performed as part of the overall clinical procedure. Internal instrument responses are measured on a series of serum-based reference standards, and the responses and corresponding concentration values are plotted graphically to produce a calibration curve, or fitted computationally to a mathematical function representing concentration in terms of an instrument's response. Advances in computing since the development of many of the known clinical methods have permitted performance of complex data processing and calculation functions directly in even the smallest hand-held instruments.
- In a serum-based assay system, the translated glucose concentration values are reported directly in units desired by the clinician. The excluded blood fractions do not figure either in the measurement or the translation process. This is not the case for a system in which the sample is in the form of whole blood. The coexisting blood fractions may affect the reported values, either through physical or chemical interference with the measurement process per se or due to their physical displacement of serum in the sample volume. That is, because the wet chemistry measures total glucose in the sample, the reported serum concentrations will vary as the relative fraction of the serum component varies from sample to sample (usually from individual to individual). In practice, the principle interference is from the red and white blood cells.
- For these and a variety of other reasons related to the manner in which blood glucose monitors and test strips are distributed, the calibration procedure for monitors is relatively complicated. Typically, calibration is performed in two steps. In the first step, a large number of test strips in multiple whole blood monitors measure a series of synthetic working standards having a range of predetermined concentrations. The standards are quite stable, and are available in relatively large quantities. The standards' values are used to construct (a) working relationship(s) between the monitors' responses and the standards' concentrations. This step provides a large number of determinations which are then pooled statistically for increased precision over the monitor and test strip populations.
- Then, in the second step, instrument response measurements are performed on whole blood samples from a relatively smaller population of human donors, which are paired with glucose values determined by the reference serum methodology to adjust the working curve to yield true reportable values. This step accounts on a statistical basis for the unique properties of human blood. Thus, human donors provide, as they should, the ultimate basis for monitor results.
- The decimal fraction of whole blood volume occupied by red cells is known as hematocrit. Hematocrit correction on whole blood determinations would not be necessary if hematocrit did not vary from person to person, because its effect could be taken into account in the calibration process by introducing whole blood samples into the instrument during calibration and relating their internally-measured numbers to corresponding serum values determined during the reference phase of the calibration process. However, hematocrit values can vary between about 0.2 for individuals who suffer from anemia and about 0.6 for newborns. Since a glucose determination is subject to about a one percent variation for each percent hematocrit variation, the resulting uncertainty in indicated glucose concentration would be clinically undesirable. Therefore, unless a glucose determination methodology is employed which is hematocrit-independent, for closest agreement with laboratory reference methods, individual determinations of glucose concentration must be compensated or corrected for hematocrit. This applies both to the donors whose blood is used during the calibration process and to the patients whose glucose concentrations are of interest to the clinician.
- The present invention concerns an in-vitro method for determining glucose, as defined in the claims.
- The invention may best be understood by referring to the following detailed description and accompanying drawings which illustrate the invention. In the drawings:
-
Fig. 1 illustrates a typical plot of current i versus time t for an instrument of the general type described; -
Fig. 2 illustrates a typical plot of i versus 1/√(t); -
Fig. 3 illustrates plots of M, the slope of Cottrell current i(t) as a function of time t, versus glucose concentration at different hematocrits; -
Fig. 4 illustrates an equivalent circuit model of an instrument and test strip of the general type described; -
Fig. 5 illustrates a schematic view of a glucose test strip of the general type described, with an applied sample, looking outward from the strip port on an instrument of the general type described; -
Fig. 6 illustrates a waveform useful in understanding the invention; -
Fig. 7 illustrates a waveform useful in understanding the invention; -
Fig. 8 illustrates a waveform useful in understanding the invention; -
Fig. 9 illustrates plots of D, the percentage initial current deficit, versus hematocrit at some arbitrarily short time after application of a step function voltage to a circuit of the type illustrated inFigs. 5-6 ; and, -
Fig. 10 illustrates an equivalent circuit model of an instrument and test strip of the general type described. - This application teaches an instrument and associated chemical and mathematical methods by which glucose and hematocrit are determined on a single sample and a single test strip.
- This application also teaches an instrument and methods by which a data stream from such an instrument's reaction sensor can be processed by internal computational apparatus in such a manner as to decompose the data into components separately representing hematocrit and glucose concentration which can then be individually calibrated to report clinical values. In this regard, it is not necessary in diabetes management to report hematocrit. It is only necessary to free the measurement of glucose concentration from the effect of hematocrit. However, there are believed to be applications for a hand-held instrument which reports both values, such as, for example, an emergency room, a battlefield, and so on. In such applications, numerical components separately representing glucose concentration and hematocrit can be individually calibrated and translated to report clinical values. And it is believed that the invention is useful in other systems besides glucose concentration and hematocrit. Using appropriate sensor technology, other analytes can be detected and their concentrations in a sample determined and reported.
- The reaction dynamics may produce such an interaction between the two components that separating the results of the two may require solution of a pair of simultaneous equations by algebraic means or by regression analysis.
- Illustratively according to the invention, the two measurements proceed essentially simultaneously in a single passage of the sample through the instrument.
- The need to account for the interference of other species with the determination of the concentration of a species of interest in biological fluids is well-documented. Among the numerous proposals for accomplishing this objective are those described in
WO99/32881 WO99/32881 - Glucose measurements on whole blood are intrinsically sensitive to hematocrit, principally, it is believed, through the volume exclusion effect. That is, the greater the hematocrit, the less glucose is available for the glucose oxidase reaction. Hence, in order to better the accuracy of such instruments, it is necessary to design the instruments and their glucose concentration determination algorithms around hematocrit, or to develop instruments and algorithms which measure hematocrit and compensate indicated glucose concentrations for the measured hematocrit, thus obtaining hematocrit-corrected glucose readings. An
instrument 20 of the general type illustrated and described inU. S. Patents: 5,243,516 ;5,288,636 ;5,352,351 ;5,385,846 ; and5,508,171 , for example, provides an incubation time, for example, ten seconds, for (a) reaction(s) to occur on astrip 22 of the general type illustrated and described inU. S. Patents: 5,243,516 ;5,288,636 ;5,352,351 ;5,385,846 ;5,508,171 ; and5,997,817 .Instrument 20 then applies across a pair ofelectrodes step function voltage 30,Fig. 6 , to circulate a current of electrons collected from, and returned to, ions produced by the glucose-glucose oxidase reaction and associated reactions. Current readings are made at intervals of, for example, a half second. A first reading, taken a very short time, for example, .02 sec., after application of thestep function voltage 30, has previously been characterized by what were thought to be unpredictable artifacts. As a result, in prior art algorithms, such readings typically have not been used in the determination of glucose concentration. - The Cottrell equation predicts that current will decrease as the inverse of the square root of time after the application of the
step function voltage 30. M is directly proportional to analyte concentration.Fig. 1 illustrates a typical plot of Cottrell current i versus time t.Fig. 2 illustrates typical plots of i versus 1/√(t). Five sets of these data are illustrated in Table 1.Table 1 sample t 1 2 3 4 5 1/√(t) 0.0 144.23 133.68 144.34 137.70 149.78 0.5 22.07 20.30 22.06 18.97 22.88 1.41 1.0 16.15 14.94 16.06 13.78 16.60 1.00 1.5 13.46 12.55 13.34 11.48 13.83 0.82 2.0 11.86 11.11 11.75 10.13 12.16 0.71 2.5 10.75 10.10 10.65 9.24 11.03 0.63 3.0 9.94 9.37 9.88 8.66 10.19 0.58 3.5 9.33 8.78 9.27 8.17 9.52 0.53 4.0 8.80 8.29 8.75 7.80 8.99 0.50 4.5 8.40 7.93 8.36 7.49 8.56 0.47 5.0 8.03 7.62 7.99 7.21 8.19 0.45 5.5 7.69 7.34 7.68 7.00 7.85 0.43 6.0 7.44 7.07 7.44 6.78 7.58 0.41 6.5 7.20 6.85 7.16 6.60 7.33 0.39 7.0 6.98 6.64 6.98 6.45 7.14 0.38 7.5 6.80 6.49 6.76 6.26 6.93 0.37 8.0 6.61 6.30 6.61 6.14 6.74 0.35 8.5 6.43 6.18 6.46 6.05 6.59 0.34 9.0 6.27 6.03 6.31 5.93 6.44 0.33 9.5 6.18 5.90 6.18 5.83 6.31 0.32 10.0 6.02 5.81 6.06 5.74 6.16 0.32 10.5 5.90 5.69 5.91 5.62 6.07 0.31 11.0 5.81 5.60 5.82 5.56 5.94 0.30 11.5 5.72 5.51 5.69 5.46 5.85 0.29 
where M is the slope of the Cottrell current curve and B is the asymptotic current, at t = ∞. - In the data studied, the B parameter was found to yield no independent correlation with glucose concentration, and considerably more variation; hence it was dropped from further consideration in the analyses.
- Although an assay for glucose could be based solely on the M parameter, a series of measurements with specially-prepared whole blood samples showed that for greater accuracy, hematocrit effects on indicated glucose concentration must be taken into account.
Fig. 3 illustrates plots of M versus glucose concentration at different hematocrits for an illustrative set of data. The constant, or iso-, hematocrit contours form a manifold of separated, nearly straight lines that converge at a point near zero glucose concentration. The lines' slopes indicate relatively high sensitivity to variation in glucose concentration. However, there definitely is also hematocrit dependence. Given a measured M, the sought-after glucose concentration might fall on any line in the manifold, depending upon the hematocrit of the sample. - In order to learn whether a single measurement process that would be compatible with an instrument primarily designed to measure the Cottrell current could be configured to concurrently provide an index of hematocrit, the electrical properties of the strip and measuring circuit were studied in further detail.
Fig. 4 illustrates an equivalent circuit model that models with a few conventional circuit elements the electrical performance ofinstrument 20 andstrip 22. The circuit illustrated inFig. 4 includes aresistor 32 that represents the ionic current flowing in the bulk of the reaction volume, as distinct from the Cottrellcurrent source 34 that represents the electrochemical charge transfer and exhibits the 1/√(t) variability noted in the above equation. The sum of these two currents is provided to a current-to-voltage (i-v)converter 36, the output of which is a voltage across afeedback resistor 38. The output voltage ofconverter 36 is then sampled and analog-to-digital (A/D) converted for further processing by other circuitry (not shown) in theinstrument 20. - In practice, for t > 1 sec., the Cottrell
current generator 34 andresistors strip capacitance 40 acts as a transitory short circuit and Cottrell current cannot build up until the voltage acrosscapacitance 40 is charged up, throughresistor 44, to the step height. For the circuit parameters at hand, this time is less than a tenth of a second. Accordingly, for very short times (t < 1 sec.), thecapacitance 40 associated withstrip 22 andsample 42 must also be included in the model, in parallel with theresistor 32 and the Cottrellcurrent source 34. Following completion of the charge-transfer process,resistors -
Capacitance 40 can be appreciated by referring toFig. 5 , a schematic view ofstrip 22 with an appliedsample 42, looking outward from thestrip 22 port oninstrument 20, that is, along thestrip 22electrodes sample 42. Theelectrodes strip 22 form a pair ofparallel plates strip 22 and between theelectrodes sample 42 including whatever reagent(s), etc., are dissolved, suspended, or otherwise present, with or in thesample 42. Since blood is a composite material including two main components, plasma (the main liquid component of blood) and red blood cells (the main cellular, or solid, component of blood), thecapacitance 40 should vary with hematocrit, to the extent that the dielectric properties of plasma and red blood cells differ. This expectation forms the basis of Fricke's equation:
sample 42; Ks = the dielectric constant of the serum component; Kc = the dielectric constant of the red blood cells; H = the hematocrit; and S = a so-called "shape factor" related to the architecture of thestrip 22, illustratively about 1.8. The dielectric constant of whole blood is directly proportional to its hematocrit. Because thecapacitance 40 of astrip 22 is directly proportional to the dielectric constant of its contents, equation (2) suggests that a determination ofstrip capacitance 40 would provide independent knowledge of the hematocrit of the sample. -
Capacitance 40 can be quantified in a number of ways. For this application, the method involves utilizing the same hardware as an instrument designed to measure Cottrell current exclusively, while revising the associated software. Referring particularly toFig. 7 , ifinstrument 20 applies astep function voltage 30 across thestrip 22electrodes voltage step 30 must charge thecapacitance 40 ofstrip 22 andsample 42. Ascapacitance 40 is charged, the voltage across thestrip electrodes voltage step 30 divided by theinternal resistance 44 ofinstrument 20, plus the leakage current ofstrip 22. Then, as the charge stored incapacitance 40 increases further, the current throughstrip 22 settles to the 1/√(t)-related Cottrell current as described by the above equation. Thus, the current at any instant is the sum of these two, and any deficit between the actual current and the Cottrell current can be attributed tocapacitance 40.Fig. 7 illustrates such a sum current trace.Fig. 8 illustrates the Cottrell current component calculated from t = 0.5 second onward. D is the percent deficit between the sum current and the Cottrell current extrapolated from t = 0.5 sec. backward toward t = 0, and includes the current flow immediately after voltage is applied at t = , for example, 0.02 sec. D as a percentage of the total current is used because it is related to hematocrit, which is a percentage. - An investigation of the initial current spike was then undertaken.
Fig. 9 illustrates plots of the percentage initial current deficit, hereinafter D, versus hematocrit at some arbitrarily short time after application of thestep function voltage 30, again, illustratively t = 0.02 sec. These plots are based upon the same set of data as the plots illustrated inFig. 3 . Each plot provides information on both glucose concentration and hematocrit. Table 2 illustrates how D is calculated for particular sets of data.Table 2 data group 1 2 3 4 5 mean of data groups standard deviation of data groups coefficients of variation of data groups Cottrell current slope M at time t 14.89 13.39 14.82 11.93 15.33 14.07 1.25 8.91 Cottrell curve intercept B 1.27 1.56 1.28 1.88 1.30 1.46 0.24 16.30 measured i(t) -B 142.96 132.12 143.06 135.82 148.48 140.49 5.80 4.13 Cottrell component 105.29 94.71 104.79 84.36 108.39 99.51 8.86 8.91 Deficit D 37.67 37.41 38.27 51.46 40.09 40.98 5.32 12.98 D/(i(t)-B)x 100% 26.35 28.32 26.75 37.89 27.00 29.26 4.36 14.91 - Table 3 contains calculated values for M and D for each of the fifteen data points (three different glucose concentrations times five different hematocrits) in one run.
Table 3 glucose concentration 40 40 120 120 450 450 hematocrit D M D M D M 20 17.1 16.0 5.4 32.9 -36.4 101.2 35 24.3 14.4 14.2 27.0 -15.3 78.4 45 29.8 14.6 22.7 23.3 -3.9 71.9 55 36.4 10.8 35.6 16.6 12.9 48.5 70 39.4 9.4 40.1 14.4 22.1 37.0 - The relationships among M, glucose concentration and hematocrit can be developed from the contents of Table 3. To accomplish this, M in Table 3 is regressed on a suitable set of variables. First, the shapes of the curves in
Fig. 3 suggest a relationship of the form
where h = (hematocrit - 0.45) and g = (glucose concentration - 120). Similarly, study of the curves ofFig. 9 suggest a relationship for D having the form
- Regression analyses on these two equations yield the following values for the constants: m0 = 23.33; m1 = -37.83; m2 = 0.1333; m3 = -0.2843; do = 23.14; d1 = 66.54; d2 = -0.0823; and, d3 = 0.1669. These regression parameters m0, m1, m2, m3 and d0, d1, d2, d3 represent this database. That is, given a new sample taken from the same sample universe, and of known h and g values, the corresponding M and D values, measured on the same reagent lot and monitor instruments, could be predicted using these parameters in equations (3) and (4). Alternatively, as would be the case in practice, the equations (3) and (4) can be inverted, numerically or algebraically, to yield the glucose and hematocrit values for a pair of M, D values measured on a sample whose glucose and hematocrit values were unknown.
- This analysis of
strip 22 with appliedsample 42 was developed based on the step function response of the measurement strip to isolate thecapacitance 40. Whereas i2(t), the charging of the relativelysmall strip 22capacitance 40 through the relativelylow output resistance 44 is essentially complete in the first second, i1(t), the Cottrell current, persists for several seconds, which permits determination of the Cottrell current trace and extrapolation back in time to extract a single value of i2(t) from the sum current i(t). Other means known to circuit designers could be employed. - For example, the circuit illustrated in
Fig. 10 provides an alternative technique for analyzing the behavior of thestrip 22/appliedsample 42 that is compatible with the measurement parts ofinstrument 20 andstrip 22, but circuit and software are revised to give a longer measurement interval for the capacitance. In the circuit realization illustrated inFig. 10 , during reading of the current between theelectrodes strip 22, a programmedvoltage source 48 andinternal resistance 44 are coupled in series between theinstrument 20 ground, or common, terminal and the anode of a blockingdiode 50. The cathode of blockingdiode 50 is coupled through the parallel combination of Cottrellcurrent generator 34, asymptoticcurrent resistor 32 andcapacitor 40 to the inverting, or -, input terminal of adifferential amplifier 36. The - input terminal ofamplifier 36 is coupled through a parallel RC feedback circuit including afeedback resistor 38 and afeedback capacitor 52, to its output terminal. The measurement of the current through thestrip 22 proceeds as described above, and the output fromamplifier 36 is sampled and A/D converted for further processing by theinstrument 20. - Then, after the measurement cycle of the current through the
strip 22, thestrip 22capacitance 40 is discharged to determine the charge accumulated on it during the current measurement phase. The programmedvoltage source 48 is stilled, and a Field Effect Transistor (FET) switch 54 is turned on. When this condition occurs, ground is coupled through abypass diode 56 to the parallel combination of the Cottrellcurrent generator 34,resistor 32 andcapacitor 40 and through theFET switch 54 to the - input terminal of anamplifier 60. The - input terminal ofamplifier 60 is coupled through the parallel combination of afeedback resistor 62 and afeedback capacitor 64 to its output terminal. The - input terminal ofamplifier 60 is also coupled through thefeedback resistor 62/feedback capacitor 64 parallel combination to its output. The output fromamplifier 60 is sampled and A/D converted for further processing by theinstrument 20. - The programmed
voltage source 48,internal resistance 44, blockingdiode 50,bypass diode 56,amplifiers feedback resistors capacitors instrument 20.Strip 22 is modeled by the Cottrellcurrent source 34,resistor 32 andcapacitor 40 coupled in parallel between the cathode of blockingdiode 50 and the cathode ofbypass diode 56. During current measurement,FET switch 54 is off, isolating thestrip 22 circuit model from the inverting (-) input terminal ofamplifier 60. When current measurement is complete, theFET switch 54 is turned on, and thestrip 22capacitance 40 is measured throughinstrument 20'samplifier 60, the output of which can be A/D converted byinstrument 20 and used to calculatecapacitance 40. - Both embodiments discussed above obtain hematocrit-free glucose determinations or simultaneous determinations of both hematocrit and glucose, making use of their relationships to circuit elements in the equivalent circuit of
Fig. 4 . This is accomplished by measuring some feature of the output current of the circuit subject to stepfunction input voltage 38 of a waveform that rapidly rises to a steady state value which is maintained for the duration of the measurement interval. The current amplitude over time, normalized to that of the step, is known as the indicial admittance. See, for example, E. Weber, Linear Transient Analysis, John Wiley and Sons, N. Y., 1954. Such indicial admittance completely characterizes the electrical properties of the circuit, and can be transformed mathematically to resolve values for the individual circuit elements. - This resolution method can bypass such a laborious transformation by temporal separation of the two current contributors. Whereas i2(t), the charging of the relatively
small strip 22capacitance 40 through the relativelylow output resistance 44 is essentially complete in the first second, i1(t), the Cottrell current, persists for several seconds, which permits determination of the Cottrell current trace and extrapolation back in time to extract a single value of i2(t) from the sum current i(t). - Because of the parallel nature of the circuit, i2(t) is the indicial admittance of the strip and sample, a single point of which has sufficed to illustrate the principle of identifying separate analytes with separate circuit elements.
- Linear Transient Analysis, referenced above, teaches at page 173 that a circuit's properties can be equivalently characterized by its impedance function, the ratio of amplitude of an applied sinusoidal voltage V(ω) to the complex circuit current I(ω), V/I as a function of frequency ω. The temporal and frequency representations are related by a set of integral equations, also taught at Linear Transient Analysis, page 73, that are readily reduced to transform between them. Thus, the measurement could be made by using a constant-amplitude, swept frequency, sinusoidal voltage generator, and recording the amplitude and phase of the output sinusoidal current, the two methods being electrically entirely equivalent. As above, various indices of the real and imaginary components of the impedance function can be extracted which, when regressed on assay values in a calibration reference set, will yield relations for the assay values of patient samples.
Claims (2)
- An in vitro method for determining the concentration of glucose in blood, a blood fraction or a control, the blood, blood fraction or control including blood cells which affects the determination of the concentration of glucose, the method including performing a first measurement on the blood, blood fraction or control which first measurement varies with both the concentration of glucose and at least one of the presence and concentration of the blood cells,
said method including a first measurement of a time-varying function i1(t) having the general form
where t is time from initiating the measurement, M is the slope of a graph of the function and B is a value the function approaches as t becomes very large, wherein said first measurement is a Cottrell current measurement
performing a second measurement on the blood, blood fraction or control which second measurement varies primarily only with the at least one of the presence and concentration of the blood cells to develop an indication of the at least one of the presence and concentration of the blood cells includes performing at least one measurement of a time-varying function i2(t), where t is time, t < some arbitrarily established time, wherein said second measurement is a capacitance measurement of a test strip with sample applied to it, made by using Linear Transient Analysis of said first measurement,
and removing an amount representative of the indicated presence or concentration of the blood cells from the concentration of glucose indicated by the first measurement. - The method of claim 1 further including contacting the blood, blood fraction or control with a reactant before performing the first measurement.
Applications Claiming Priority (3)
| Application Number | Priority Date | Filing Date | Title |
|---|---|---|---|
| US46030 | 2001-11-07 | ||
| US10/046,030 US7018843B2 (en) | 2001-11-07 | 2001-11-07 | Instrument |
| PCT/EP2002/012422 WO2003040728A2 (en) | 2001-11-07 | 2002-11-07 | Method and apparatus for the determination of glucose |
Publications (2)
| Publication Number | Publication Date |
|---|---|
| EP1456666A2 EP1456666A2 (en) | 2004-09-15 |
| EP1456666B1 true EP1456666B1 (en) | 2012-07-18 |
Family
ID=21941198
Family Applications (1)
| Application Number | Title | Priority Date | Filing Date |
|---|---|---|---|
| EP02787588A Expired - Lifetime EP1456666B1 (en) | 2001-11-07 | 2002-11-07 | Method for the determination of glucose |
Country Status (5)
| Country | Link |
|---|---|
| US (3) | US7018843B2 (en) |
| EP (1) | EP1456666B1 (en) |
| JP (2) | JP4180518B2 (en) |
| CA (1) | CA2465800C (en) |
| WO (1) | WO2003040728A2 (en) |
Families Citing this family (55)
| Publication number | Priority date | Publication date | Assignee | Title |
|---|---|---|---|---|
| US7494816B2 (en) * | 1997-12-22 | 2009-02-24 | Roche Diagnostic Operations, Inc. | System and method for determining a temperature during analyte measurement |
| US7390667B2 (en) * | 1997-12-22 | 2008-06-24 | Roche Diagnostics Operations, Inc. | System and method for analyte measurement using AC phase angle measurements |
| US8071384B2 (en) | 1997-12-22 | 2011-12-06 | Roche Diagnostics Operations, Inc. | Control and calibration solutions and methods for their use |
| US7407811B2 (en) * | 1997-12-22 | 2008-08-05 | Roche Diagnostics Operations, Inc. | System and method for analyte measurement using AC excitation |
| EP2889611B1 (en) * | 1999-11-15 | 2019-09-04 | PHC Holdings Corporation | Biosensor and measurement apparatus. |
| EP1256798A4 (en) | 2000-11-30 | 2009-05-20 | Panasonic Corp | Biosensor, measuring instrument for biosensor, and method of quantifying substrate |
| US7195923B2 (en) * | 2001-01-31 | 2007-03-27 | Scripps Laboratories, Inc. | Ratiometric determination of glycated protein |
| US7018843B2 (en) * | 2001-11-07 | 2006-03-28 | Roche Diagnostics Operations, Inc. | Instrument |
| US8148164B2 (en) | 2003-06-20 | 2012-04-03 | Roche Diagnostics Operations, Inc. | System and method for determining the concentration of an analyte in a sample fluid |
| US7488601B2 (en) * | 2003-06-20 | 2009-02-10 | Roche Diagnostic Operations, Inc. | System and method for determining an abused sensor during analyte measurement |
| CN100472210C (en) * | 2003-12-04 | 2009-03-25 | 松下电器产业株式会社 | Blood component measuring method, sensor used therefor, and measuring instrument |
| EP1707953B1 (en) * | 2003-12-04 | 2015-07-01 | Panasonic Healthcare Holdings Co., Ltd. | Method of measuring hematocrit (Hct) |
| BRPI0507376A (en) | 2004-02-06 | 2007-07-10 | Bayer Healthcare Llc | oxidizable species as an internal reference for biosensors and method of use |
| NZ550825A (en) * | 2004-03-31 | 2009-01-31 | Bayer Healthcare Llc | Method and apparatus for implementing threshold based correction functions for biosensors |
| CA2559297C (en) | 2004-04-19 | 2012-05-22 | Matsushita Electric Industrial Co., Ltd. | Method for measuring blood components and biosensor and measuring instrument for use therein |
| BRPI0510779A (en) * | 2004-05-14 | 2007-11-20 | Bayer Healthcare Llc | methods for performing hematocrit adjustment in assays and devices for same |
| US7356366B2 (en) * | 2004-08-02 | 2008-04-08 | Cardiac Pacemakers, Inc. | Device for monitoring fluid status |
| US7344626B2 (en) | 2005-04-15 | 2008-03-18 | Agamatrix, Inc. | Method and apparatus for detection of abnormal traces during electrochemical analyte detection |
| US20070129618A1 (en) * | 2005-06-20 | 2007-06-07 | Daniel Goldberger | Blood parameter testing system |
| CN103558284B (en) | 2005-07-20 | 2017-04-12 | 安晟信医疗科技控股公司 | Gated amperometry |
| CN101273266B (en) | 2005-09-30 | 2012-08-22 | 拜尔健康护理有限责任公司 | Gated voltammetry |
| WO2007119574A2 (en) * | 2006-03-23 | 2007-10-25 | Ajinomoto Co., Inc. | A method for producing an l-amino acid using bacterium of the enterobacteriaceae family with attenuated expression of a gene coding for small rna |
| US8529751B2 (en) | 2006-03-31 | 2013-09-10 | Lifescan, Inc. | Systems and methods for discriminating control solution from a physiological sample |
| TW200835737A (en) | 2006-11-01 | 2008-09-01 | Dow Global Technologies Inc | Polyurethane compositions and articles prepared therefrom, and methods for making the same |
| US8101062B2 (en) * | 2007-07-26 | 2012-01-24 | Nipro Diagnostics, Inc. | System and methods for determination of analyte concentration using time resolved amperometry |
| US8088272B2 (en) * | 2007-07-26 | 2012-01-03 | Nipro Diagnostics, Inc. | System and methods for determination of analyte concentration using time resolved amperometry |
| US8778168B2 (en) * | 2007-09-28 | 2014-07-15 | Lifescan, Inc. | Systems and methods of discriminating control solution from a physiological sample |
| WO2009076302A1 (en) | 2007-12-10 | 2009-06-18 | Bayer Healthcare Llc | Control markers for auto-detection of control solution and methods of use |
| US8603768B2 (en) | 2008-01-17 | 2013-12-10 | Lifescan, Inc. | System and method for measuring an analyte in a sample |
| WO2009093840A2 (en) * | 2008-01-22 | 2009-07-30 | Industry Foundation Of Chonnam National University | Method and apparatus for estimating features of target materials by using kinetic change information |
| JP5427362B2 (en) * | 2008-03-25 | 2014-02-26 | テルモ株式会社 | Method and apparatus for measuring hematocrit value or blood component concentration |
| US8551320B2 (en) | 2008-06-09 | 2013-10-08 | Lifescan, Inc. | System and method for measuring an analyte in a sample |
| CN103760213B (en) | 2008-07-10 | 2016-04-13 | 拜尔健康护理有限责任公司 | There is the system and method for the working cycle of amperometry and volt-ampere analysis |
| GB0814238D0 (en) * | 2008-08-04 | 2008-09-10 | Oxford Biosensors Ltd | Enhancement of electrochemical response |
| US8760178B2 (en) | 2009-09-30 | 2014-06-24 | Arkray, Inc. | Method for measuring target component in erythrocyte-containing specimen |
| JP5350960B2 (en) * | 2009-09-30 | 2013-11-27 | アークレイ株式会社 | Method for measuring target components in erythrocyte-containing samples |
| US8101065B2 (en) * | 2009-12-30 | 2012-01-24 | Lifescan, Inc. | Systems, devices, and methods for improving accuracy of biosensors using fill time |
| US8877034B2 (en) | 2009-12-30 | 2014-11-04 | Lifescan, Inc. | Systems, devices, and methods for measuring whole blood hematocrit based on initial fill velocity |
| US8932445B2 (en) | 2010-09-30 | 2015-01-13 | Cilag Gmbh International | Systems and methods for improved stability of electrochemical sensors |
| US8617370B2 (en) | 2010-09-30 | 2013-12-31 | Cilag Gmbh International | Systems and methods of discriminating between a control sample and a test fluid using capacitance |
| TWI470226B (en) * | 2011-03-01 | 2015-01-21 | Eps Bio Technology Corp | Methods for compensating a blood glucose concentration |
| EP2607492A1 (en) * | 2011-12-22 | 2013-06-26 | Roche Diagniostics GmbH | Method for determining the concentration of an analyte |
| US9903830B2 (en) | 2011-12-29 | 2018-02-27 | Lifescan Scotland Limited | Accurate analyte measurements for electrochemical test strip based on sensed physical characteristic(s) of the sample containing the analyte |
| KR101727447B1 (en) | 2013-03-15 | 2017-04-14 | 에프. 호프만-라 로슈 아게 | Methods of scaling data used to construct biosensor algorithms as well as devices, apparatuses and systems incorporating the same |
| CN105247356B (en) | 2013-03-15 | 2017-11-07 | 豪夫迈·罗氏有限公司 | Use the method and the unit and system of merging methods described of the information of the recovery pulse in being measured from electrochemical analyte |
| JP6412027B2 (en) | 2013-03-15 | 2018-10-24 | エフ.ホフマン−ラ ロシュ アーゲーF. Hoffmann−La Roche Aktiengesellschaft | Method for fail-safe electrochemical measurement of analyte and device, apparatus and system incorporating the same |
| CA2900572C (en) | 2013-03-15 | 2018-02-13 | F. Hoffmann-La Roche Ag | Methods of detecting high antioxidant levels during electrochemical measurements and failsafing an analyte concentration therefrom as well as devices, apparatuses and systems incorporting the same |
| US9459231B2 (en) | 2013-08-29 | 2016-10-04 | Lifescan Scotland Limited | Method and system to determine erroneous measurement signals during a test measurement sequence |
| US9243276B2 (en) | 2013-08-29 | 2016-01-26 | Lifescan Scotland Limited | Method and system to determine hematocrit-insensitive glucose values in a fluid sample |
| TWI586333B (en) * | 2013-09-06 | 2017-06-11 | A blood volume detecting method and a detecting device using the same | |
| US10809246B2 (en) * | 2014-05-23 | 2020-10-20 | Nova Biomedical Corporation | Hemolysis detection method and system |
| WO2016073395A1 (en) | 2014-11-03 | 2016-05-12 | Roche Diabetes Care, Inc. | Electrode arrangements for electrochemical test elements and methods of use thereof |
| TWI580958B (en) | 2015-04-28 | 2017-05-01 | 財團法人工業技術研究院 | Methods for measuring analyte concentration |
| TWI591330B (en) * | 2016-06-06 | 2017-07-11 | 盛群半導體股份有限公司 | Measuring Method Associated To Hematocrit For Whole Blood And Measuring Circuit Thereof |
| JP2019529935A (en) | 2016-10-05 | 2019-10-17 | エフ ホフマン−ラ ロッシュ アクチェン ゲゼルシャフト | Detection reagents and electrode arrangements for multi-sample diagnostic test elements and methods of using them |
Citations (3)
| Publication number | Priority date | Publication date | Assignee | Title |
|---|---|---|---|---|
| US5352351A (en) * | 1993-06-08 | 1994-10-04 | Boehringer Mannheim Corporation | Biosensing meter with fail/safe procedures to prevent erroneous indications |
| DE9422380U1 (en) * | 1993-06-08 | 2000-12-14 | Roche Diagnostics Corp | Biosensor measuring device with error protection procedures to avoid incorrect displays |
| WO2001057510A2 (en) * | 2000-02-02 | 2001-08-09 | Lifescan, Inc. | Electrochemical methods and devices for use in the determination of hematocrit corrected analyte concentrations |
Family Cites Families (109)
| Publication number | Priority date | Publication date | Assignee | Title |
|---|---|---|---|---|
| GB973807A (en) | 1959-12-24 | 1964-10-28 | Yellow Springs Instr | Improvements in instruments for determining characteristics of blood |
| US3648159A (en) | 1970-03-11 | 1972-03-07 | Us Air Force | Portable, self-contained system for analyzing biological fluids or the like |
| US3770607A (en) | 1970-04-07 | 1973-11-06 | Secretary | Glucose determination apparatus |
| CH559912A5 (en) | 1971-09-09 | 1975-03-14 | Hoffmann La Roche | |
| US3925183A (en) | 1972-06-16 | 1975-12-09 | Energetics Science | Gas detecting and quantitative measuring device |
| US3902970A (en) | 1973-07-30 | 1975-09-02 | Leeds & Northrup Co | Flow-through amperometric measuring system and method |
| CH585907A5 (en) | 1973-08-06 | 1977-03-15 | Hoffmann La Roche | |
| US3922598A (en) | 1974-08-15 | 1975-11-25 | Robert R Steuer | Hematocrit measurements by electrical conductivity |
| US3937615A (en) | 1974-12-17 | 1976-02-10 | Leeds & Northrup Company | Auto-ranging glucose measuring system |
| US4052596A (en) | 1974-12-23 | 1977-10-04 | Hycel, Inc. | Automatic hematology analyzer |
| US4230537A (en) | 1975-12-18 | 1980-10-28 | Monsanto Company | Discrete biochemical electrode system |
| US4040908A (en) | 1976-03-12 | 1977-08-09 | Children's Hospital Medical Center | Polarographic analysis of cholesterol and other macromolecular substances |
| US4123701A (en) | 1976-07-01 | 1978-10-31 | United States Surgical Corporation | Disposable sample card having a well with electrodes for testing a liquid sample |
| US4127448A (en) | 1977-02-28 | 1978-11-28 | Schick Karl G | Amperometric-non-enzymatic method of determining sugars and other polyhydroxy compounds |
| JPS5912135B2 (en) | 1977-09-28 | 1984-03-21 | 松下電器産業株式会社 | enzyme electrode |
| JPS5460996A (en) | 1977-10-22 | 1979-05-16 | Mitsubishi Chem Ind | Method of measuring amount of sugar |
| US4214968A (en) | 1978-04-05 | 1980-07-29 | Eastman Kodak Company | Ion-selective electrode |
| DE2817363C2 (en) | 1978-04-20 | 1984-01-26 | Siemens AG, 1000 Berlin und 8000 München | Method for determining the concentration of sugar and a suitable electrocatalytic sugar sensor |
| DE2823485C2 (en) | 1978-05-30 | 1986-03-27 | Albert Prof. Dr. 3550 Marburg Huch | Trough electrode |
| US4240027A (en) | 1978-08-31 | 1980-12-16 | The United States Of America As Represented By The Secretary Of The Army | Electromagnetic method for the noninvasive analysis of cell membrane physiology and pharmacology |
| US4225410A (en) | 1978-12-04 | 1980-09-30 | Technicon Instruments Corporation | Integrated array of electrochemical sensors |
| US4273134A (en) | 1979-05-22 | 1981-06-16 | Biochem International Inc. | Fixation ring assembly and method of assembling a sensor head |
| US4265250A (en) | 1979-07-23 | 1981-05-05 | Battle Research And Development Associates | Electrode |
| US4263343A (en) | 1979-08-13 | 1981-04-21 | Eastman Kodak Company | Reference elements for ion-selective membrane electrodes |
| US4301414A (en) | 1979-10-29 | 1981-11-17 | United States Surgical Corporation | Disposable sample card and method of making same |
| US4301412A (en) | 1979-10-29 | 1981-11-17 | United States Surgical Corporation | Liquid conductivity measuring system and sample cards therefor |
| US4303887A (en) | 1979-10-29 | 1981-12-01 | United States Surgical Corporation | Electrical liquid conductivity measuring system |
| DE3029579C2 (en) | 1980-08-05 | 1985-12-12 | Boehringer Mannheim Gmbh, 6800 Mannheim | Method and means for separating plasma or serum from whole blood |
| US4816224A (en) | 1980-08-05 | 1989-03-28 | Boehringer Mannheim Gmbh | Device for separating plasma or serum from whole blood and analyzing the same |
| US4407959A (en) | 1980-10-29 | 1983-10-04 | Fuji Electric Co., Ltd. | Blood sugar analyzing apparatus |
| US4413628A (en) | 1980-11-19 | 1983-11-08 | Tamulis Walter G | pH Monitor electrode electrolyte cartridge |
| US4420564A (en) | 1980-11-21 | 1983-12-13 | Fuji Electric Company, Ltd. | Blood sugar analyzer having fixed enzyme membrane sensor |
| DE3047782A1 (en) | 1980-12-18 | 1982-07-08 | Drägerwerk AG, 2400 Lübeck | CIRCUIT FOR THE CORRECTION OF THE SENSOR OUTPUT SIZE |
| US4436094A (en) | 1981-03-09 | 1984-03-13 | Evreka, Inc. | Monitor for continuous in vivo measurement of glucose concentration |
| AT369254B (en) | 1981-05-07 | 1982-12-27 | Otto Dipl Ing Dr Tech Prohaska | MEDICAL PROBE |
| US4440175A (en) | 1981-08-10 | 1984-04-03 | University Patents, Inc. | Membrane electrode for non-ionic species |
| US4431004A (en) | 1981-10-27 | 1984-02-14 | Bessman Samuel P | Implantable glucose sensor |
| DE3202067C2 (en) | 1982-01-23 | 1984-06-20 | Holger Dr. 5100 Aachen Kiesewetter | Device for determining the hematocrit value |
| JPS5913948A (en) * | 1982-07-15 | 1984-01-24 | Shimadzu Corp | Electrostatic capacity type measuring apparatus of hematocrit |
| DE3228542A1 (en) | 1982-07-30 | 1984-02-02 | Siemens AG, 1000 Berlin und 8000 München | METHOD FOR DETERMINING THE CONCENTRATION OF ELECTROCHEMICALLY IMPLEMENTABLE SUBSTANCES |
| DE3228551A1 (en) | 1982-07-30 | 1984-02-02 | Siemens AG, 1000 Berlin und 8000 München | METHOD FOR DETERMINING SUGAR CONCENTRATION |
| US4679562A (en) | 1983-02-16 | 1987-07-14 | Cardiac Pacemakers, Inc. | Glucose sensor |
| US5509410A (en) | 1983-06-06 | 1996-04-23 | Medisense, Inc. | Strip electrode including screen printing of a single layer |
| CA1219040A (en) | 1983-05-05 | 1987-03-10 | Elliot V. Plotkin | Measurement of enzyme-catalysed reactions |
| US4517291A (en) | 1983-08-15 | 1985-05-14 | E. I. Du Pont De Nemours And Company | Biological detection process using polymer-coated electrodes |
| SE8305704D0 (en) | 1983-10-18 | 1983-10-18 | Leo Ab | Cuvette |
| US4820399A (en) | 1984-08-31 | 1989-04-11 | Shimadzu Corporation | Enzyme electrodes |
| US4671288A (en) | 1985-06-13 | 1987-06-09 | The Regents Of The University Of California | Electrochemical cell sensor for continuous short-term use in tissues and blood |
| WO1986007632A1 (en) | 1985-06-21 | 1986-12-31 | Matsushita Electric Industrial Co., Ltd. | Biosensor and method of manufacturing same |
| US4938860A (en) | 1985-06-28 | 1990-07-03 | Miles Inc. | Electrode for electrochemical sensors |
| US4734184A (en) | 1985-08-29 | 1988-03-29 | Diamond Sensor Systems, Inc. | Self-activating hydratable solid-state electrode apparatus |
| US4805624A (en) | 1985-09-09 | 1989-02-21 | The Montefiore Hospital Association Of Western Pa | Low-potential electrochemical redox sensors |
| EP0215669A3 (en) | 1985-09-17 | 1989-08-30 | Seiko Instruments Inc. | Analytical device and method for analysis of biochemicals, microbes and cells |
| US4935106A (en) | 1985-11-15 | 1990-06-19 | Smithkline Diagnostics, Inc. | Ion selective/enzymatic electrode medical analyzer device and method of use |
| GB8608700D0 (en) | 1986-04-10 | 1986-05-14 | Genetics Int Inc | Measurement of electroactive species in solution |
| US4795542A (en) | 1986-04-24 | 1989-01-03 | St. Jude Medical, Inc. | Electrochemical concentration detector device |
| US4703756A (en) | 1986-05-06 | 1987-11-03 | The Regents Of The University Of California | Complete glucose monitoring system with an implantable, telemetered sensor module |
| GB8612861D0 (en) | 1986-05-27 | 1986-07-02 | Cambridge Life Sciences | Immobilised enzyme biosensors |
| US4750496A (en) | 1987-01-28 | 1988-06-14 | Xienta, Inc. | Method and apparatus for measuring blood glucose concentration |
| JPS636451A (en) | 1986-06-27 | 1988-01-12 | Terumo Corp | Enzyme sensor |
| GB8618022D0 (en) | 1986-07-23 | 1986-08-28 | Unilever Plc | Electrochemical measurements |
| US4935346A (en) * | 1986-08-13 | 1990-06-19 | Lifescan, Inc. | Minimum procedure system for the determination of analytes |
| US4894137A (en) | 1986-09-12 | 1990-01-16 | Omron Tateisi Electronics Co. | Enzyme electrode |
| JPS63111453A (en) | 1986-10-29 | 1988-05-16 | Omron Tateisi Electronics Co | Enzyme electrode |
| US4897162A (en) | 1986-11-14 | 1990-01-30 | The Cleveland Clinic Foundation | Pulse voltammetry |
| US4759828A (en) | 1987-04-09 | 1988-07-26 | Nova Biomedical Corporation | Glucose electrode and method of determining glucose |
| US4975647A (en) | 1987-06-01 | 1990-12-04 | Nova Biomedical Corporation | Controlling machine operation with respect to consumable accessory units |
| US5160980A (en) | 1987-07-27 | 1992-11-03 | Boehringer Mannheim Corp. | Test piece coloration comparative decision unit |
| US4940945A (en) | 1987-11-02 | 1990-07-10 | Biologix Inc. | Interface circuit for use in a portable blood chemistry measuring apparatus |
| AU601635B2 (en) | 1987-11-09 | 1990-09-13 | Boehringer Mannheim Corporation | Test sample color comparison device |
| US5128015A (en) | 1988-03-15 | 1992-07-07 | Tall Oak Ventures | Method and apparatus for amperometric diagnostic analysis |
| US5108564A (en) | 1988-03-15 | 1992-04-28 | Tall Oak Ventures | Method and apparatus for amperometric diagnostic analysis |
| US4871258A (en) | 1988-04-29 | 1989-10-03 | Boehringer Mannheim Corporation | Color test meter |
| US5053199A (en) | 1989-02-21 | 1991-10-01 | Boehringer Mannheim Corporation | Electronically readable information carrier |
| US5269891A (en) | 1989-03-09 | 1993-12-14 | Novo Nordisk A/S | Method and apparatus for determination of a constituent in a fluid |
| US5312762A (en) | 1989-03-13 | 1994-05-17 | Guiseppi Elie Anthony | Method of measuring an analyte by measuring electrical resistance of a polymer film reacting with the analyte |
| GB8927377D0 (en) | 1989-12-04 | 1990-01-31 | Univ Edinburgh | Improvements in and relating to amperometric assays |
| US5508171A (en) | 1989-12-15 | 1996-04-16 | Boehringer Mannheim Corporation | Assay method with enzyme electrode system |
| US4999632A (en) | 1989-12-15 | 1991-03-12 | Boehringer Mannheim Corporation | Analog to digital conversion with noise reduction |
| WO1991009139A1 (en) | 1989-12-15 | 1991-06-27 | Boehringer Mannheim Corporation | Redox mediator reagent and biosensor |
| US5243516A (en) | 1989-12-15 | 1993-09-07 | Boehringer Mannheim Corporation | Biosensing instrument and method |
| US4999582A (en) | 1989-12-15 | 1991-03-12 | Boehringer Mannheim Corp. | Biosensor electrode excitation circuit |
| JPH0820412B2 (en) | 1990-07-20 | 1996-03-04 | 松下電器産業株式会社 | Quantitative analysis method and device using disposable sensor |
| EP0576536B1 (en) | 1991-02-27 | 2001-12-12 | Roche Diagnostics Corporation | Method of communicating with microcomputer controlled instruments |
| US5246858A (en) | 1991-02-27 | 1993-09-21 | Boehringer Mannheim Corporation | Apparatus and method for analyzing a body fluid |
| US5232668A (en) | 1991-02-27 | 1993-08-03 | Boehringer Mannheim Corporation | Test strip holding and reading mechanism for a meter |
| WO1992015859A1 (en) | 1991-02-27 | 1992-09-17 | Boehringer Mannheim Corporation | Apparatus and method for analyzing body fluids |
| US5264103A (en) | 1991-10-18 | 1993-11-23 | Matsushita Electric Industrial Co., Ltd. | Biosensor and a method for measuring a concentration of a substrate in a sample |
| JPH05297039A (en) * | 1992-04-10 | 1993-11-12 | M Jones Sado | Method and apparatus for detecting variation of capacitance using computer |
| US5387327A (en) | 1992-10-19 | 1995-02-07 | Duquesne University Of The Holy Ghost | Implantable non-enzymatic electrochemical glucose sensor |
| US5371687A (en) | 1992-11-20 | 1994-12-06 | Boehringer Mannheim Corporation | Glucose test data acquisition and management system |
| FR2701117B1 (en) | 1993-02-04 | 1995-03-10 | Asulab Sa | Electrochemical measurement system with multizone sensor, and its application to glucose measurement. |
| US5385846A (en) | 1993-06-03 | 1995-01-31 | Boehringer Mannheim Corporation | Biosensor and method for hematocrit determination |
| US5366609A (en) | 1993-06-08 | 1994-11-22 | Boehringer Mannheim Corporation | Biosensing meter with pluggable memory key |
| US5508203A (en) | 1993-08-06 | 1996-04-16 | Fuller; Milton E. | Apparatus and method for radio frequency spectroscopy using spectral analysis |
| JP3322726B2 (en) * | 1993-08-17 | 2002-09-09 | 長野計器株式会社 | Capacitance detection circuit |
| US5841023A (en) | 1993-08-31 | 1998-11-24 | Boehringer Mannheim Corporation | Magnet for medical instrument |
| CA2168966C (en) | 1993-08-31 | 2007-07-31 | George R. Lennert | Analog heater control for medical instrument |
| JPH09502119A (en) | 1993-08-31 | 1997-03-04 | ベーリンガー・マンハイム・コーポレーション | Power supply monitoring and control device for medical equipment |
| US5522255A (en) | 1993-08-31 | 1996-06-04 | Boehringer Mannheim Corporation | Fluid dose, flow and coagulation sensor for medical instrument |
| US6153069A (en) | 1995-02-09 | 2000-11-28 | Tall Oak Ventures | Apparatus for amperometric Diagnostic analysis |
| AUPN661995A0 (en) | 1995-11-16 | 1995-12-07 | Memtec America Corporation | Electrochemical cell 2 |
| US6121050A (en) * | 1997-08-29 | 2000-09-19 | Han; Chi-Neng Arthur | Analyte detection systems |
| US5997817A (en) | 1997-12-05 | 1999-12-07 | Roche Diagnostics Corporation | Electrochemical biosensor test strip |
| BR9814386B1 (en) * | 1997-12-22 | 2009-08-11 | apparatus and methods for determining the concentration of a medically significant component of a biological fluid. | |
| JP3848993B2 (en) * | 1998-01-06 | 2006-11-22 | アークレイ株式会社 | Method and apparatus for measuring the amount of components in the presence of coexisting substances |
| WO1999060391A1 (en) * | 1998-05-20 | 1999-11-25 | Arkray, Inc. | Method and apparatus for electrochemical measurement using statistical technique |
| US6287451B1 (en) * | 1999-06-02 | 2001-09-11 | Handani Winarta | Disposable sensor and method of making |
| US7018843B2 (en) * | 2001-11-07 | 2006-03-28 | Roche Diagnostics Operations, Inc. | Instrument |
-
2001
- 2001-11-07 US US10/046,030 patent/US7018843B2/en not_active Expired - Lifetime
-
2002
- 2002-11-07 CA CA002465800A patent/CA2465800C/en not_active Expired - Lifetime
- 2002-11-07 EP EP02787588A patent/EP1456666B1/en not_active Expired - Lifetime
- 2002-11-07 WO PCT/EP2002/012422 patent/WO2003040728A2/en active Application Filing
- 2002-11-07 JP JP2003542930A patent/JP4180518B2/en not_active Expired - Lifetime
-
2005
- 2005-08-08 US US11/199,488 patent/US7927882B2/en active Active
-
2007
- 2007-09-28 JP JP2007256103A patent/JP4722900B2/en not_active Expired - Lifetime
-
2008
- 2008-08-04 US US12/185,439 patent/US7923258B2/en not_active Expired - Fee Related
Patent Citations (3)
| Publication number | Priority date | Publication date | Assignee | Title |
|---|---|---|---|---|
| US5352351A (en) * | 1993-06-08 | 1994-10-04 | Boehringer Mannheim Corporation | Biosensing meter with fail/safe procedures to prevent erroneous indications |
| DE9422380U1 (en) * | 1993-06-08 | 2000-12-14 | Roche Diagnostics Corp | Biosensor measuring device with error protection procedures to avoid incorrect displays |
| WO2001057510A2 (en) * | 2000-02-02 | 2001-08-09 | Lifescan, Inc. | Electrochemical methods and devices for use in the determination of hematocrit corrected analyte concentrations |
Also Published As
| Publication number | Publication date |
|---|---|
| CA2465800C (en) | 2009-09-01 |
| JP4180518B2 (en) | 2008-11-12 |
| US20080293082A1 (en) | 2008-11-27 |
| US7923258B2 (en) | 2011-04-12 |
| US7018843B2 (en) | 2006-03-28 |
| JP2005509161A (en) | 2005-04-07 |
| US7927882B2 (en) | 2011-04-19 |
| EP1456666A2 (en) | 2004-09-15 |
| US20060035384A1 (en) | 2006-02-16 |
| WO2003040728A3 (en) | 2004-02-19 |
| CA2465800A1 (en) | 2003-05-15 |
| WO2003040728A2 (en) | 2003-05-15 |
| US20030096420A1 (en) | 2003-05-22 |
| JP2008046141A (en) | 2008-02-28 |
| JP4722900B2 (en) | 2011-07-13 |
Similar Documents
| Publication | Publication Date | Title |
|---|---|---|
| EP1456666B1 (en) | Method for the determination of glucose | |
| CA2566495C (en) | Performing hematocrit adjustment in glucose assays | |
| CN1183384C (en) | Meter | |
| JP3848993B2 (en) | Method and apparatus for measuring the amount of components in the presence of coexisting substances | |
| EP3438661B1 (en) | Slope-based compensation | |
| EP2577302B1 (en) | Slope-based compensation method including secondary output signals | |
| US20070264721A1 (en) | System and method for analyte measurement using a nonlinear sample response | |
| KR20060022286A (en) | Devices and methods relating to electrochemical biosensors | |
| CN105378484B (en) | The standardized calibration of analyte concentration determination | |
| CN105283765B (en) | The systematic error compensation of analyte concentration determination | |
| US11268925B2 (en) | Intertwined electrical input signals |
Legal Events
| Date | Code | Title | Description |
|---|---|---|---|
| PUAI | Public reference made under article 153(3) epc to a published international application that has entered the european phase |
Free format text: ORIGINAL CODE: 0009012 |
|
| AK | Designated contracting states |
Kind code of ref document: A2 Designated state(s): AT BE BG CH CY CZ DE DK EE ES FI FR GB GR IE IT LI LU MC NL PT SE SK TR |
|
| 17P | Request for examination filed |
Effective date: 20040819 |
|
| 17Q | First examination report despatched |
Effective date: 20100208 |
|
| GRAP | Despatch of communication of intention to grant a patent |
Free format text: ORIGINAL CODE: EPIDOSNIGR1 |
|
| RIC1 | Information provided on ipc code assigned before grant |
Ipc: G01N 27/327 20060101ALI20120113BHEP Ipc: G01N 33/487 20060101ALI20120113BHEP Ipc: G01N 33/50 20060101ALI20120113BHEP Ipc: G01N 33/66 20060101AFI20120113BHEP |
|
| RTI1 | Title (correction) |
Free format text: METHOD FOR THE DETERMINATION OF GLUCOSE |
|
| GRAS | Grant fee paid |
Free format text: ORIGINAL CODE: EPIDOSNIGR3 |
|
| GRAA | (expected) grant |
Free format text: ORIGINAL CODE: 0009210 |
|
| AK | Designated contracting states |
Kind code of ref document: B1 Designated state(s): AT BE BG CH CY CZ DE DK EE ES FI FR GB GR IE IT LI LU MC NL PT SE SK TR |
|
| REG | Reference to a national code |
Ref country code: GB Ref legal event code: FG4D |
|
| REG | Reference to a national code |
Ref country code: DE Ref legal event code: R081 Ref document number: 60243347 Country of ref document: DE Owner name: ROCHE DIABETES CARE GMBH, DE Free format text: FORMER OWNERS: ROCHE DIAGNOSTICS GMBH, 68305 MANNHEIM, DE; F. HOFFMANN-LA ROCHE AG, 4070 BASEL, CH |
|
| REG | Reference to a national code |
Ref country code: CH Ref legal event code: EP |
|
| REG | Reference to a national code |
Ref country code: IE Ref legal event code: FG4D Ref country code: AT Ref legal event code: REF Ref document number: 567144 Country of ref document: AT Kind code of ref document: T Effective date: 20120815 |
|
| REG | Reference to a national code |
Ref country code: DE Ref legal event code: R096 Ref document number: 60243347 Country of ref document: DE Effective date: 20120913 |
|
| REG | Reference to a national code |
Ref country code: NL Ref legal event code: VDEP Effective date: 20120718 |
|
| REG | Reference to a national code |
Ref country code: AT Ref legal event code: MK05 Ref document number: 567144 Country of ref document: AT Kind code of ref document: T Effective date: 20120718 |
|
| PG25 | Lapsed in a contracting state [announced via postgrant information from national office to epo] |
Ref country code: FI Free format text: LAPSE BECAUSE OF FAILURE TO SUBMIT A TRANSLATION OF THE DESCRIPTION OR TO PAY THE FEE WITHIN THE PRESCRIBED TIME-LIMIT Effective date: 20120718 Ref country code: BE Free format text: LAPSE BECAUSE OF FAILURE TO SUBMIT A TRANSLATION OF THE DESCRIPTION OR TO PAY THE FEE WITHIN THE PRESCRIBED TIME-LIMIT Effective date: 20120718 Ref country code: CY Free format text: LAPSE BECAUSE OF FAILURE TO SUBMIT A TRANSLATION OF THE DESCRIPTION OR TO PAY THE FEE WITHIN THE PRESCRIBED TIME-LIMIT Effective date: 20120718 Ref country code: AT Free format text: LAPSE BECAUSE OF FAILURE TO SUBMIT A TRANSLATION OF THE DESCRIPTION OR TO PAY THE FEE WITHIN THE PRESCRIBED TIME-LIMIT Effective date: 20120718 |
|
| PG25 | Lapsed in a contracting state [announced via postgrant information from national office to epo] |
Ref country code: PT Free format text: LAPSE BECAUSE OF FAILURE TO SUBMIT A TRANSLATION OF THE DESCRIPTION OR TO PAY THE FEE WITHIN THE PRESCRIBED TIME-LIMIT Effective date: 20121119 Ref country code: SE Free format text: LAPSE BECAUSE OF FAILURE TO SUBMIT A TRANSLATION OF THE DESCRIPTION OR TO PAY THE FEE WITHIN THE PRESCRIBED TIME-LIMIT Effective date: 20120718 Ref country code: GR Free format text: LAPSE BECAUSE OF FAILURE TO SUBMIT A TRANSLATION OF THE DESCRIPTION OR TO PAY THE FEE WITHIN THE PRESCRIBED TIME-LIMIT Effective date: 20121019 |
|
| PG25 | Lapsed in a contracting state [announced via postgrant information from national office to epo] |
Ref country code: NL Free format text: LAPSE BECAUSE OF FAILURE TO SUBMIT A TRANSLATION OF THE DESCRIPTION OR TO PAY THE FEE WITHIN THE PRESCRIBED TIME-LIMIT Effective date: 20120718 |
|
| PG25 | Lapsed in a contracting state [announced via postgrant information from national office to epo] |
Ref country code: DK Free format text: LAPSE BECAUSE OF FAILURE TO SUBMIT A TRANSLATION OF THE DESCRIPTION OR TO PAY THE FEE WITHIN THE PRESCRIBED TIME-LIMIT Effective date: 20120718 Ref country code: CZ Free format text: LAPSE BECAUSE OF FAILURE TO SUBMIT A TRANSLATION OF THE DESCRIPTION OR TO PAY THE FEE WITHIN THE PRESCRIBED TIME-LIMIT Effective date: 20120718 Ref country code: EE Free format text: LAPSE BECAUSE OF FAILURE TO SUBMIT A TRANSLATION OF THE DESCRIPTION OR TO PAY THE FEE WITHIN THE PRESCRIBED TIME-LIMIT Effective date: 20120718 Ref country code: ES Free format text: LAPSE BECAUSE OF FAILURE TO SUBMIT A TRANSLATION OF THE DESCRIPTION OR TO PAY THE FEE WITHIN THE PRESCRIBED TIME-LIMIT Effective date: 20121029 |
|
| PLBE | No opposition filed within time limit |
Free format text: ORIGINAL CODE: 0009261 |
|
| STAA | Information on the status of an ep patent application or granted ep patent |
Free format text: STATUS: NO OPPOSITION FILED WITHIN TIME LIMIT |
|
| PG25 | Lapsed in a contracting state [announced via postgrant information from national office to epo] |
Ref country code: SK Free format text: LAPSE BECAUSE OF FAILURE TO SUBMIT A TRANSLATION OF THE DESCRIPTION OR TO PAY THE FEE WITHIN THE PRESCRIBED TIME-LIMIT Effective date: 20120718 Ref country code: IT Free format text: LAPSE BECAUSE OF FAILURE TO SUBMIT A TRANSLATION OF THE DESCRIPTION OR TO PAY THE FEE WITHIN THE PRESCRIBED TIME-LIMIT Effective date: 20120718 |
|
| 26N | No opposition filed |
Effective date: 20130419 |
|
| REG | Reference to a national code |
Ref country code: CH Ref legal event code: PL |
|
| GBPC | Gb: european patent ceased through non-payment of renewal fee |
Effective date: 20121107 |
|
| PG25 | Lapsed in a contracting state [announced via postgrant information from national office to epo] |
Ref country code: LI Free format text: LAPSE BECAUSE OF NON-PAYMENT OF DUE FEES Effective date: 20121130 Ref country code: CH Free format text: LAPSE BECAUSE OF NON-PAYMENT OF DUE FEES Effective date: 20121130 Ref country code: BG Free format text: LAPSE BECAUSE OF FAILURE TO SUBMIT A TRANSLATION OF THE DESCRIPTION OR TO PAY THE FEE WITHIN THE PRESCRIBED TIME-LIMIT Effective date: 20121018 |
|
| REG | Reference to a national code |
Ref country code: DE Ref legal event code: R097 Ref document number: 60243347 Country of ref document: DE Effective date: 20130419 Ref country code: IE Ref legal event code: MM4A |
|
| REG | Reference to a national code |
Ref country code: FR Ref legal event code: ST Effective date: 20130731 |
|
| PG25 | Lapsed in a contracting state [announced via postgrant information from national office to epo] |
Ref country code: IE Free format text: LAPSE BECAUSE OF NON-PAYMENT OF DUE FEES Effective date: 20121107 |
|
| PG25 | Lapsed in a contracting state [announced via postgrant information from national office to epo] |
Ref country code: GB Free format text: LAPSE BECAUSE OF NON-PAYMENT OF DUE FEES Effective date: 20121107 Ref country code: FR Free format text: LAPSE BECAUSE OF NON-PAYMENT OF DUE FEES Effective date: 20121130 |
|
| PG25 | Lapsed in a contracting state [announced via postgrant information from national office to epo] |
Ref country code: TR Free format text: LAPSE BECAUSE OF FAILURE TO SUBMIT A TRANSLATION OF THE DESCRIPTION OR TO PAY THE FEE WITHIN THE PRESCRIBED TIME-LIMIT Effective date: 20120718 Ref country code: MC Free format text: LAPSE BECAUSE OF NON-PAYMENT OF DUE FEES Effective date: 20121130 |
|
| PG25 | Lapsed in a contracting state [announced via postgrant information from national office to epo] |
Ref country code: LU Free format text: LAPSE BECAUSE OF NON-PAYMENT OF DUE FEES Effective date: 20121107 |
|
| REG | Reference to a national code |
Ref country code: DE Ref legal event code: R081 Ref document number: 60243347 Country of ref document: DE Owner name: ROCHE DIABETES CARE GMBH, DE Free format text: FORMER OWNER: ROCHE DIAGNOSTICS GMBH, 68305 MANNHEIM, DE |
|
| PGFP | Annual fee paid to national office [announced via postgrant information from national office to epo] |
Ref country code: DE Payment date: 20211013 Year of fee payment: 20 |
|
| REG | Reference to a national code |
Ref country code: DE Ref legal event code: R071 Ref document number: 60243347 Country of ref document: DE |